

Analysis: Improvements needed on SC road conditions and safety
Last month, Reason Foundation released its 24th Annual Highway Report on the condition of America’s roads and bridges. The annual study provides state-by-state comparative data, rating each state according to factors such as rural/urban interstate conditions and cost-effectiveness of spending per mile.
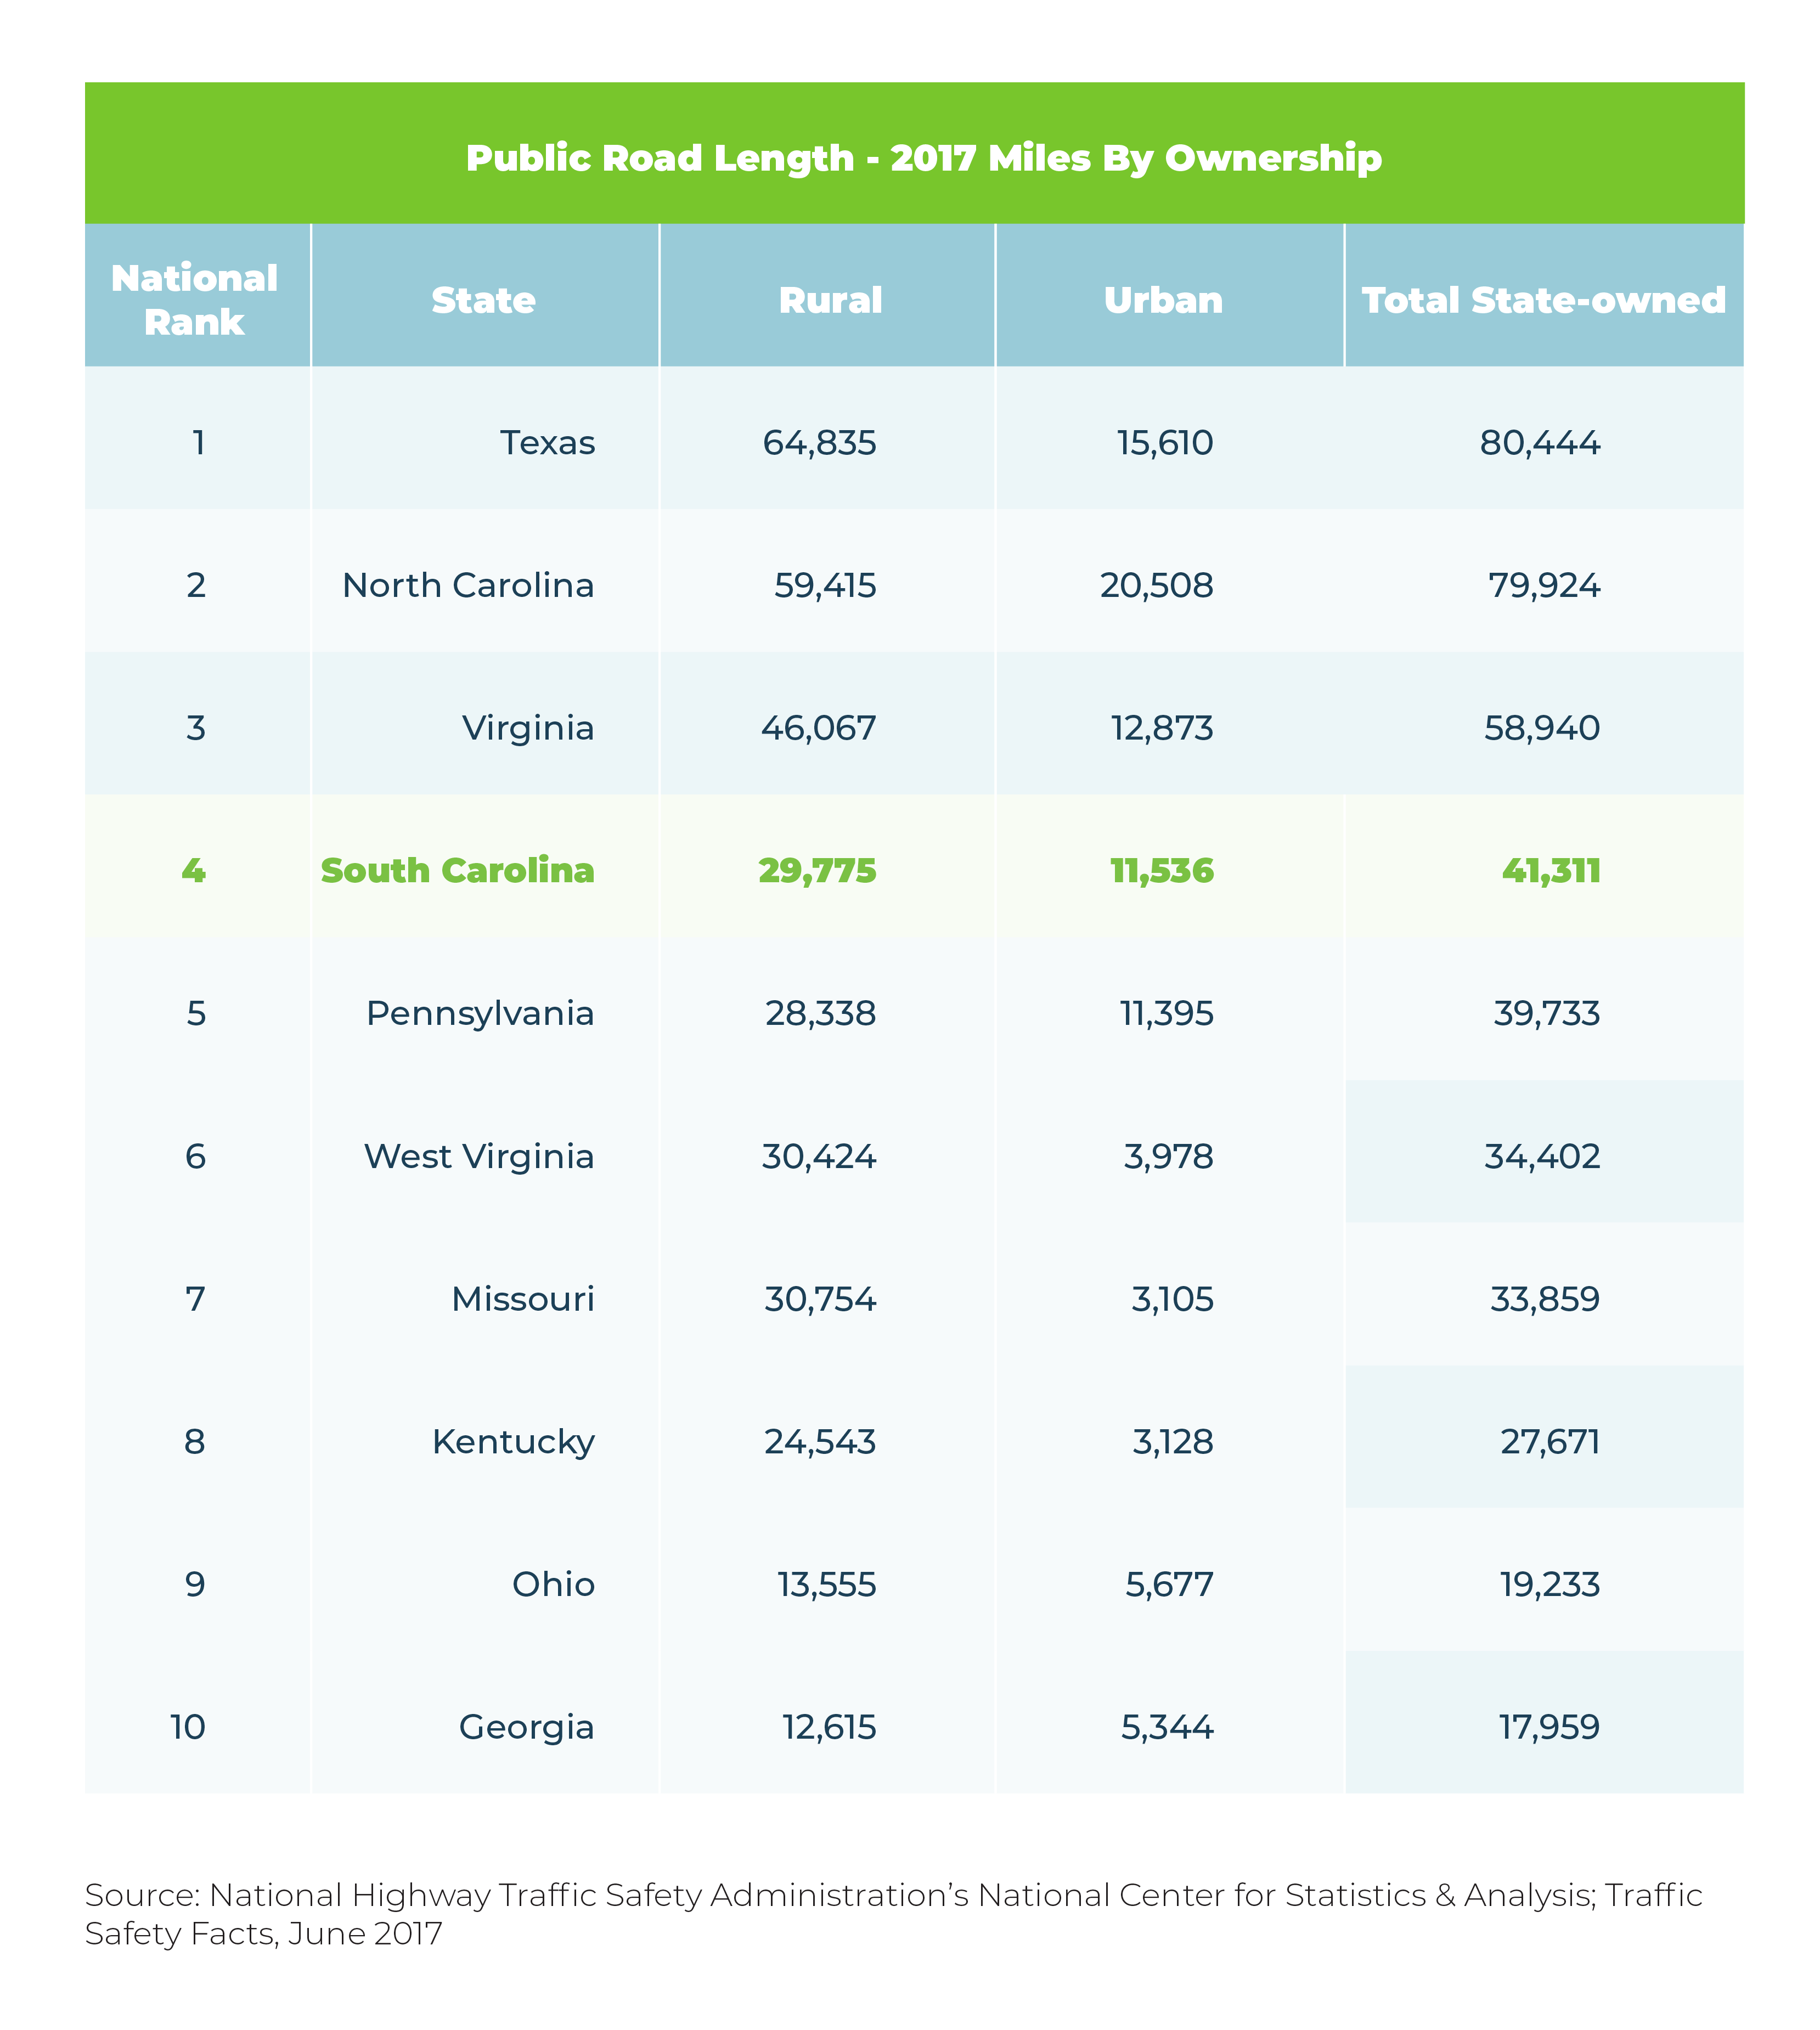
This report did not contain much good news for the Palmetto State, as South Carolina declined in its weighted average position from 5th place nationally to 20th. Reason’s rankings are focused on a state’s cost effectiveness or “cost versus quality” – a formula which is based on state spending per state-controlled mileage. Because South Carolina owns the 4th highest number of miles in the country, our spending per mile is very low, which should bolster our ranking. With that in mind, let’s take a look at some of the data points that stand out in the report.
Highlights from Report
Here’s a brief summary from Reason on South Carolina’s highway conditions:
“South Carolina declined 15 positions, from 5th to 20th in the overall rankings, as rural Interstate pavement condition and rural arterial pavement condition both declined significantly. The percentage of deficient bridges also increased significantly. South Carolina also has the highest fatality rate in the country for the second year in a row.”
Poor pavement condition of rural roads
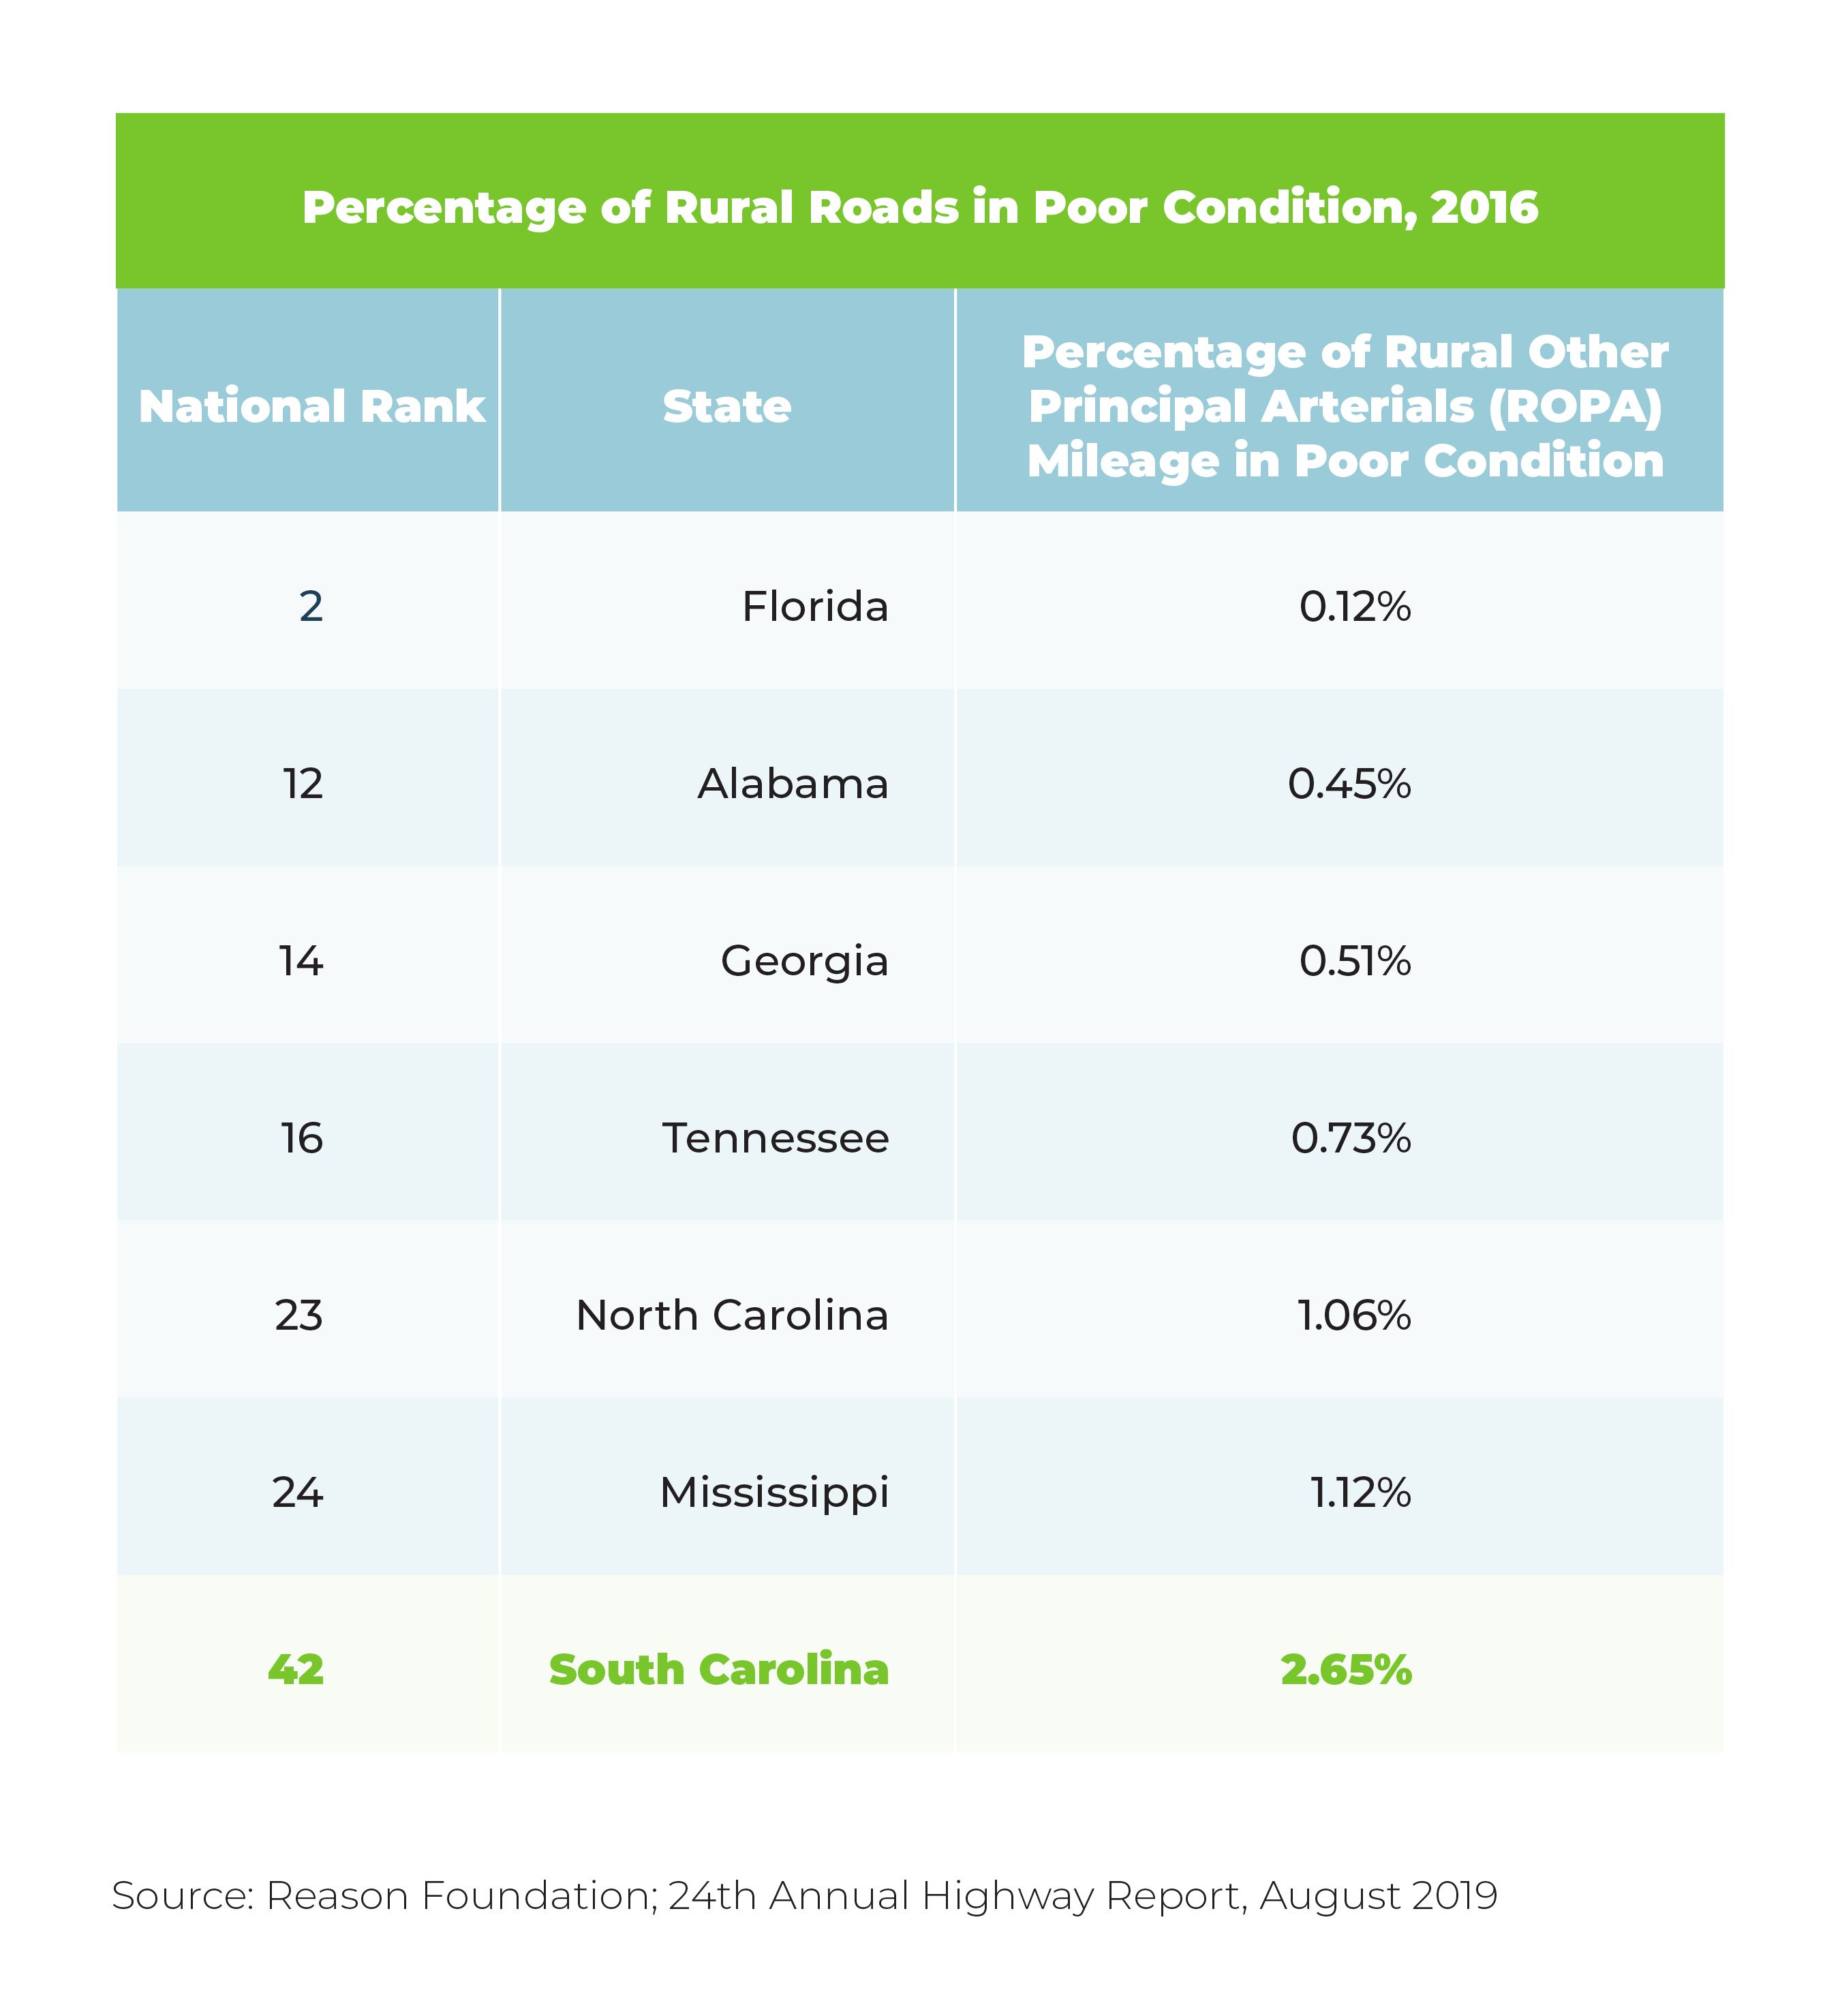
One metric used, ROPA (Rural Other Principal Arterials), which is based on two to four lane highways connecting cities, has South Carolina coming in at 42nd in the country. When compared to other states in the Southeast, South Carolina is behind by a significant margin.
Structurally deficient bridges
Another troubling statistic in the report is the condition of our bridges. We declined 11 places from Reason’s report last year and now sit at 32nd in the nation with about 10% of our bridges considered “structurally deficient.” This may still be fresh on the minds of those in the Charleston area who had to sit in traffic last year during a week where cable issues on the Wando River bridge caused I-526 closures and heavy congestion.
Highest fatality rate in the country
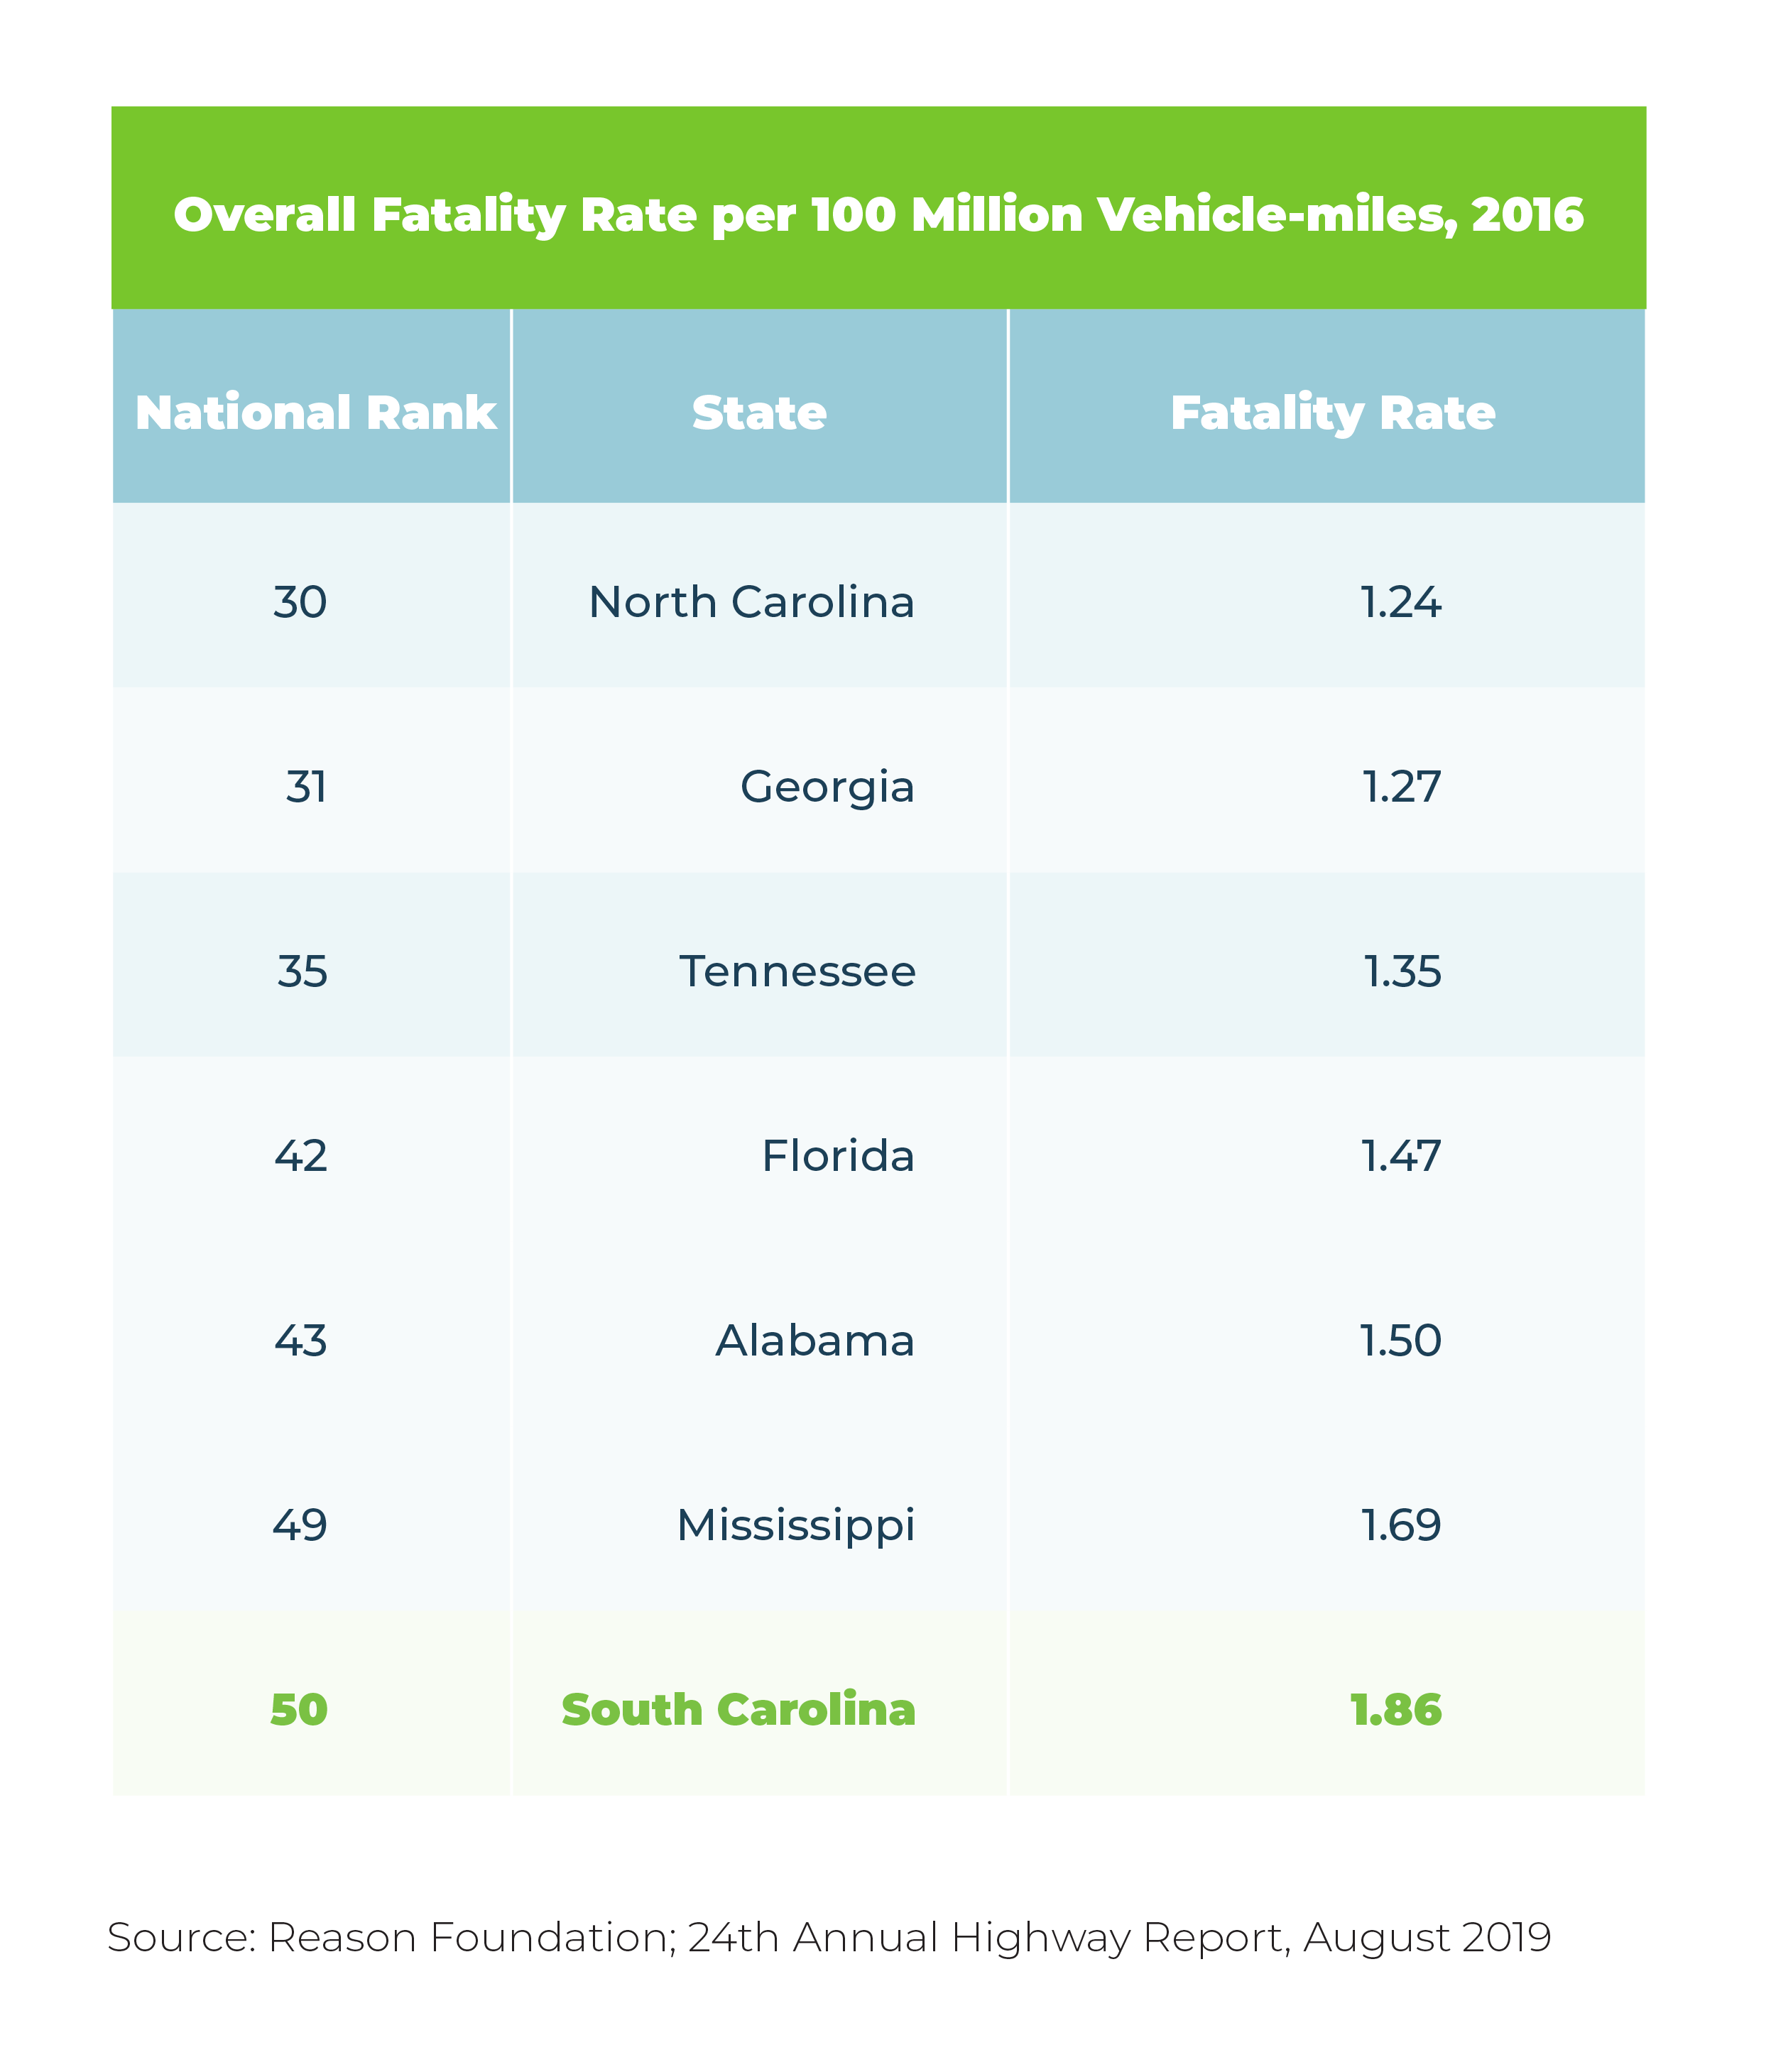
Probably the most difficult statistic to hear is the issue of highway fatalities. Reason reports that South Carolina now has the highest fatality rate in the nation… two years in a row. Here’s how we compare to our neighbors:
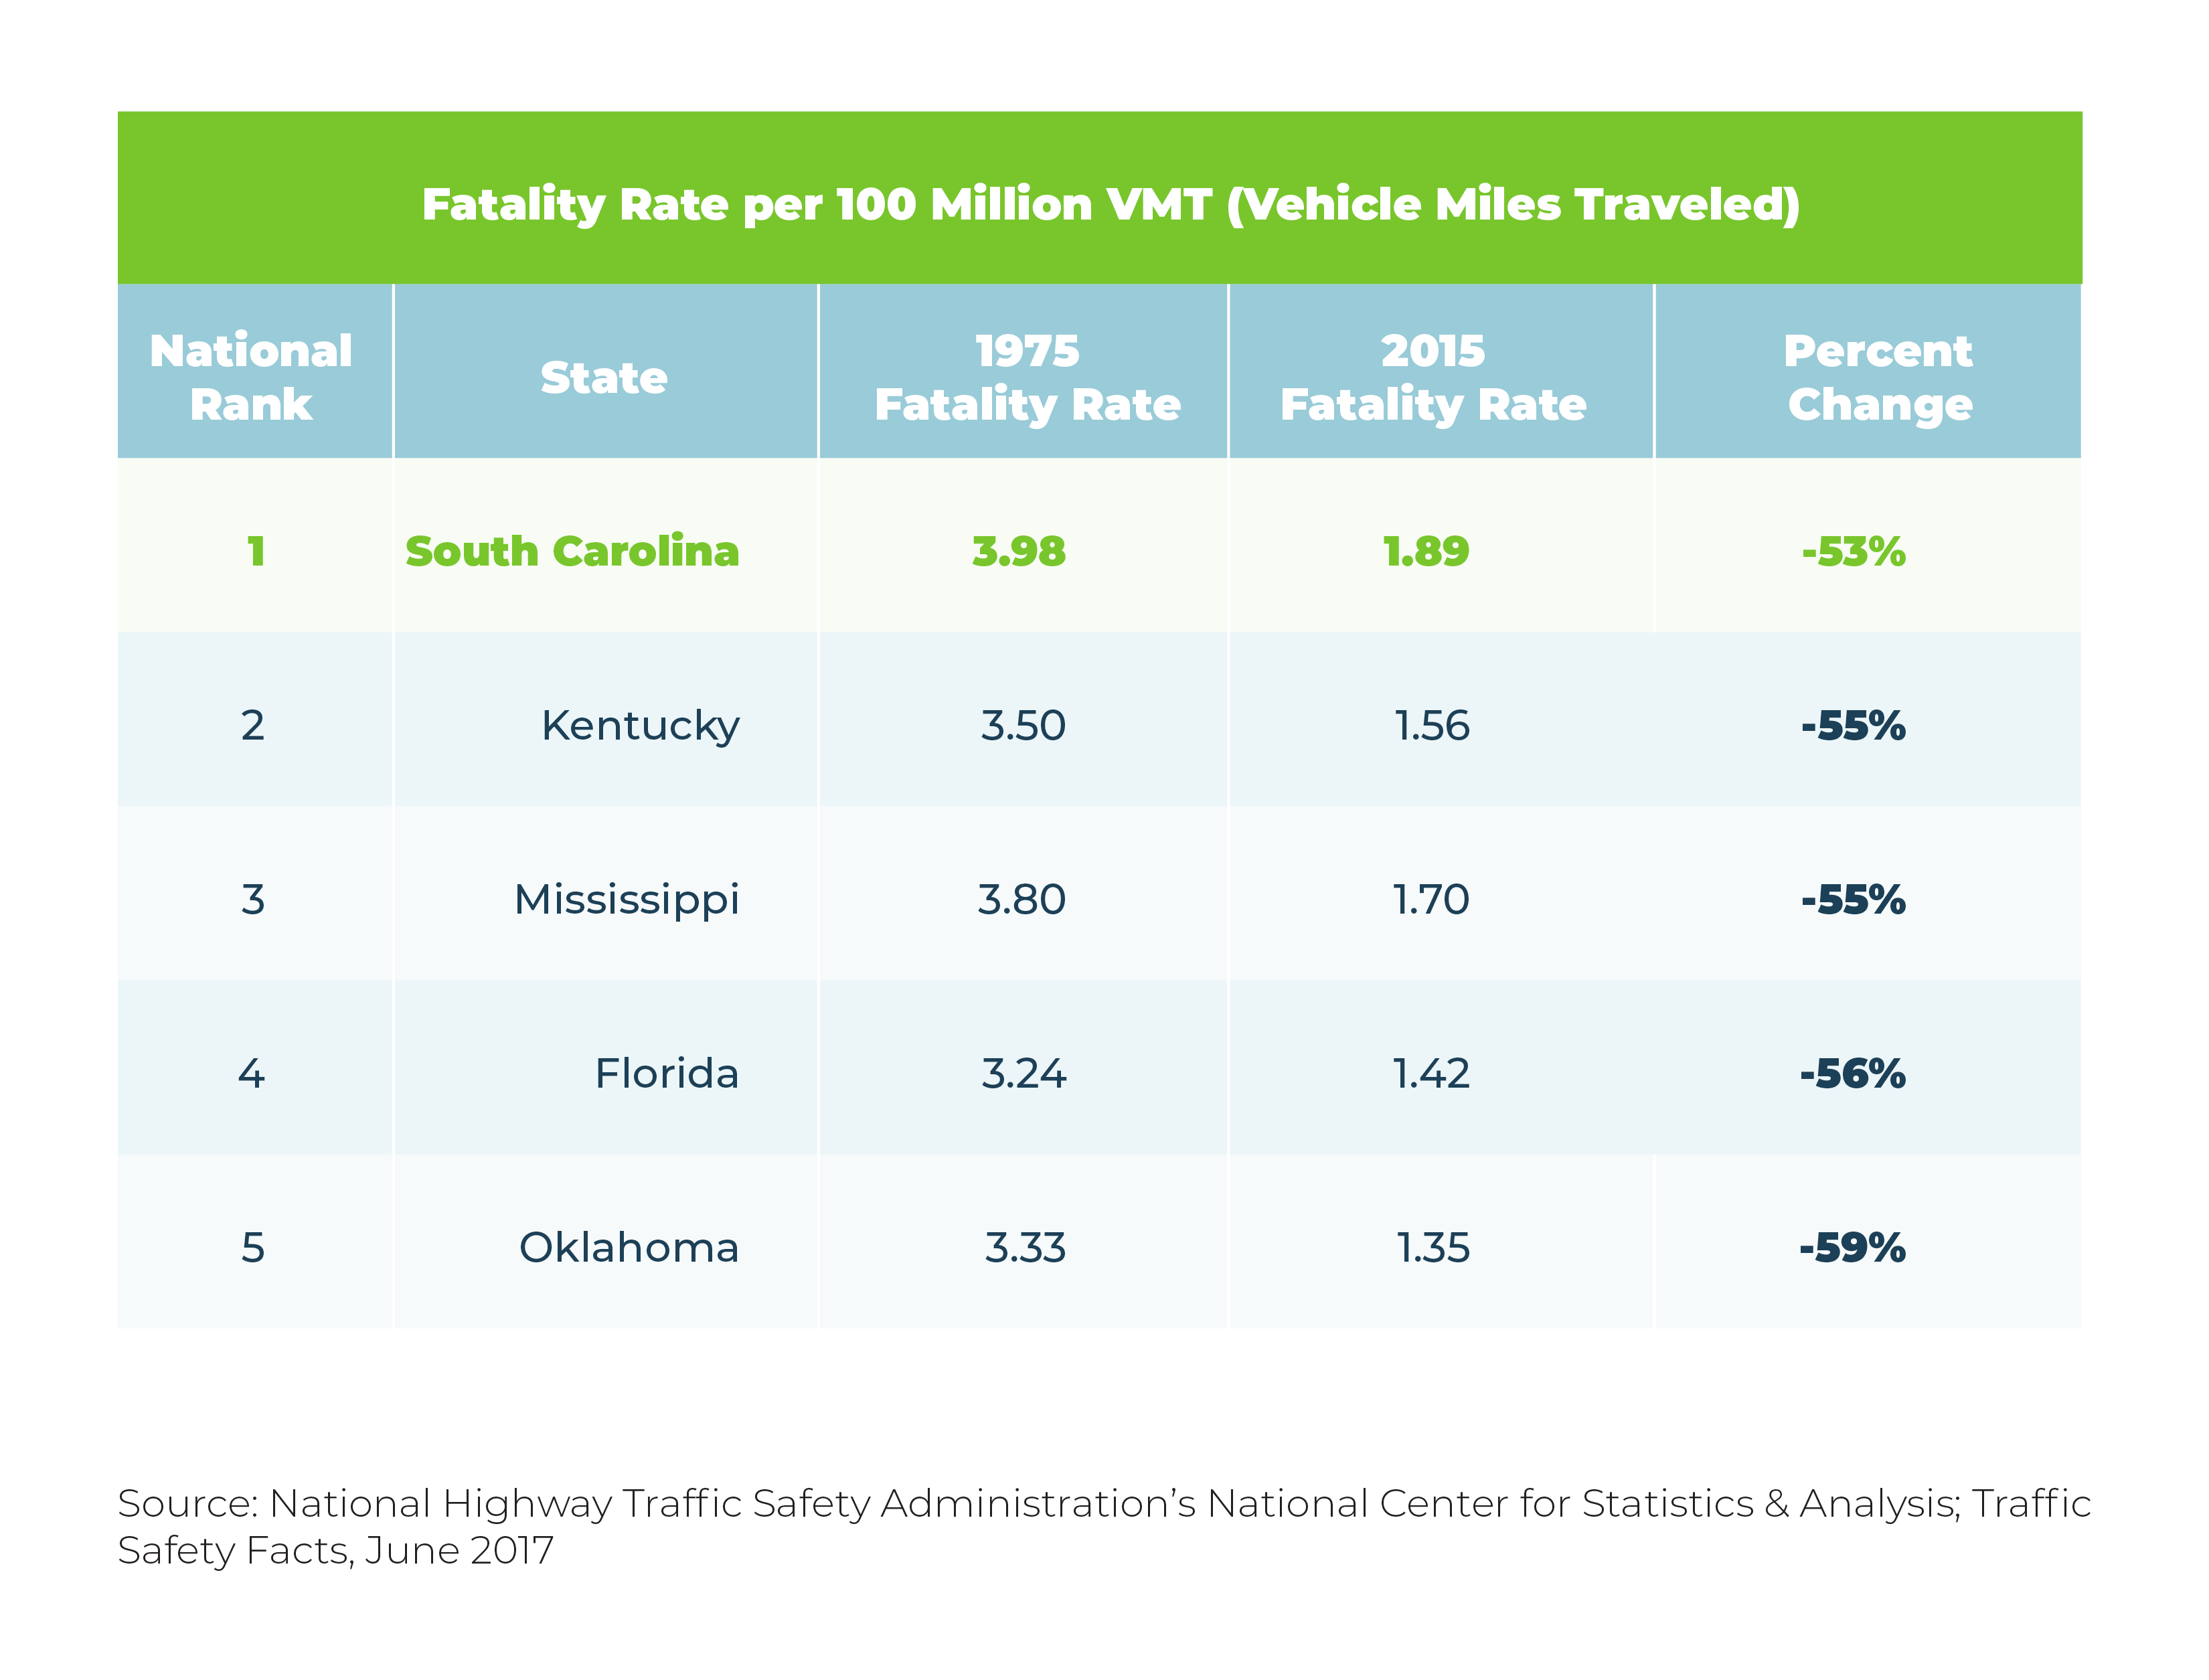
Although Reason reports that South Carolina has been last in the country only for the past two years, when you look at the overall percentage change in fatality rates across the country, South Carolina had the least amount of improvement between 1975 and 2015.
In 2015, SCDOT released a plan called “Target Zero” to help address highway fatalities. The plan involved targeting “Emphasis Areas” such as high-risk intersections, impaired driving, and occupants not wearing seat belts. Although the data above is from 2015-2017, newer data from SCDOT shows that fatalities have increased through 2018. Preliminary reports from 2019 show a slight decrease when compared to last years numbers.
Fatality rates come down to multiple factors, so it’s difficult to pin-point one specific area that is the cause of South Carolina’s poor safety history. Bills to rein-in distracted driving have been introduced in addition to SCDOT’s initiatives. Time will tell whether these proposed solutions would—if passed—make a dent in our fatality rate.
Spending Takeaways
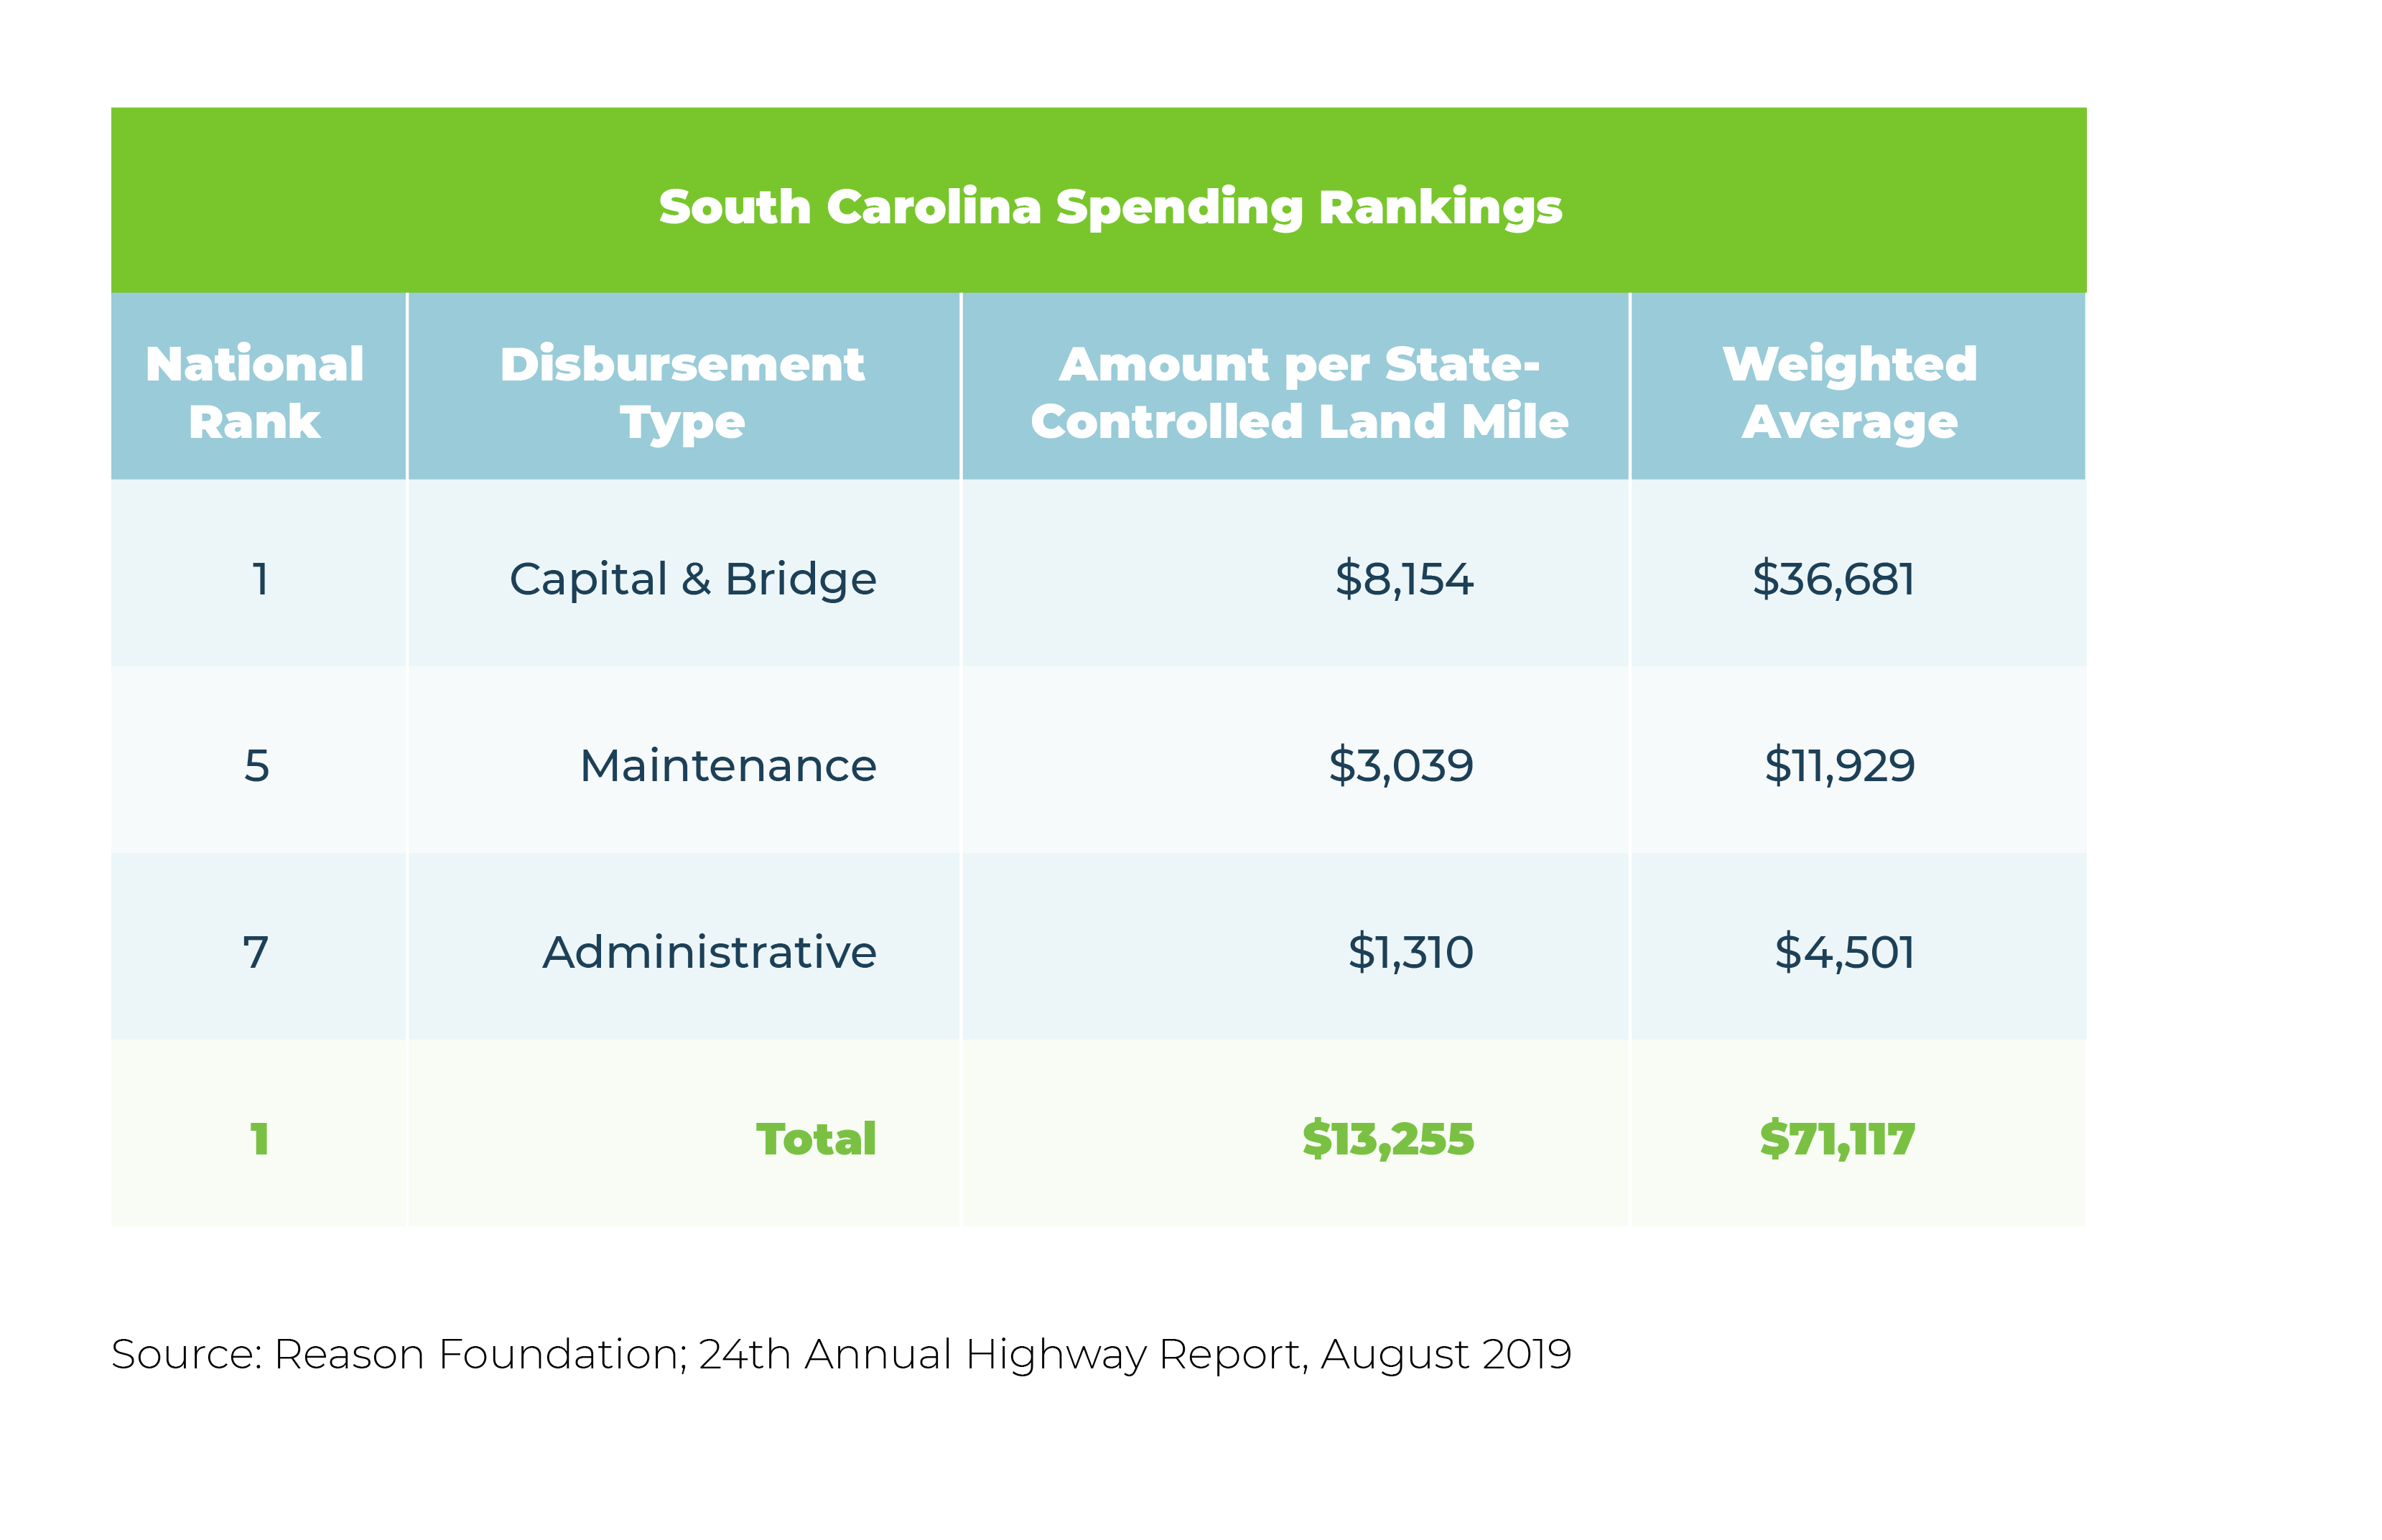
Aside from looking at the condition of our roads and fatality rates, Reason also examined highway spending. They did this in four different categories, all on a “per state-controlled lane-mile” basis: capital and bridge disbursements, maintenance disbursements, administrative disbursements, and total disbursements.
Before presenting the data on spending, there is an important caveat: South Carolina owns more than 41,000 miles of roads, which is the 4th highest in the country—not as a percentage, but in actual total miles! So, this data may lead you to think that we spend next to nothing on our roads—but that’s not necessarily true.
All of this information is based on state-controlled lane-miles, meaning the more miles the state owns, the lower the average spending per lane-mile will appear.
Here’s where South Carolina came down on all four categories (NOTE: 1st place represents the LOWEST amount spent per lane-mile):
One category that is important to examine is maintenance disbursements. Let’s look at how much we’re spending per state-controlled lane-mile compared to our neighbors:

This category is particularly interesting when you consider that South Carolina falls behind Mississippi and Alabama on the pavement conditions of small rural roads, yet we spend more on maintenance, especially when you take into account that this data is based on state-controlled lane-miles which South Carolina owns four times that of both Alabama and Mississippi—10,931 and 10,911 respectively, compared to South Carolina’s 41,311.
Some Context
There have been a variety of studies examining the state of South Carolina’s transportation system, from quality of our roads to spending – Reason Foundation is not the first to release a report like this. The Greenville News published an article a couple years ago that provides very helpful historical context along with rankings from other groups, including Reason’s.
But here are few facts that are helpful in understanding the context in which this report was released:
South Carolina owns a lot of roads.
As we mentioned earlier, South Carolina has the 4th largest state-maintained road system in the country, most of which is rural highways. This is a significant statistic as South Carolina is only 24th in the country in terms of total road mileage.
Widespread “state-ification” of roads started in the 1920’s when the federal government started a highway building program that allowed states to receive aid for their state-owned roads. Many local roads quickly began to be transferred into the state system. According to Walter Edgar’s South Carolina a History, from 1946 to 1950, almost 5,000 secondary routes were paved. Following that, before the age of home-rule, legislators began to transfer local roads from their home districts in order to gain access to the resources available for state-owned roads.
The law that allowed local roads to be transferred to state ownership was amended in 2013 so that roads could be ceded back to the local government, but only if they consented and agreed to maintain them. Needless to say, concerns from local governments about funding proved to be quite the road-block to transferring those roads back.
With so many rural state-owned miles to maintain, it’s no wonder that we fall behind other states in terms of rural pavement condition. As we build new highways and expand existing ones, we must have a transparent and efficient plan in place to account for the maintenance of existing infrastructure.
South Carolina passed a gas tax bill in 2017 to generate more dollars for the roads.
In 2017, South Carolina approved a gas tax increase that would—starting on July 1, 2017—increase by 2 cents until July 1, 2022, totaling 12 cents over 6 years. After 2022, South Carolina’s gas tax will sit at 28.75 cents per gallon. The State reported that South Carolina motorists had collectively paid almost $200 million dollars leading up to the gas tax increase of 2 cents per gallon on July 1, 2019. This was passed in the hopes that the new revenue would help address the poor condition of many state-owned roads.
Possible Reforms
One observation from the data presented above is the seeming relative efficiency of North Carolina’s spending.
They own a remarkable 79,000 miles (almost double South Carolina’s 41,000) and spend $5.3 billion compared to South Carolina’s $2.2 billion. Yes, they spend a lot more than South Carolina, but they also own a lot more miles—but you don’t see North Carolina at the bottom of any of the pavement condition lists in Reason’s report. In fact, North Carolina has a better rating than South Carolina on all but one of Reason’s criteria.
Over the past 10 years, North Carolina has passed bipartisan reforms in order to make sure that transportation revenue actually goes to maintaining roads and bridges and that decision-making follows specific criteria and goals instead of being dependent on the political pull of certain elected officials.
There have been many conversations at the Statehouse about reforming the South Carolina infrastructure decision-making process—those conversations are more relevant than ever now. As South Carolina continues to see growth, we have to prioritize to keep up with our existing infrastructure and plan for future needs.
Final Takeaways
There is no sugar-coating it—South Carolina still has a lot of work to do in regard to pavement conditions and overall road safety. But finding solutions has to start with asking the right questions. Questions like: How do we prioritize transportation spending to address our existing and crumbling infrastructure? Do we have a unified plan to address our highest-in-the-nation fatality rate? At the moment, these questions do not have readily apparent answers.
Because of the significant number of state-owned roads, it’s critical that South Carolina focuses on maintenance of our existing infrastructure. Only time will tell if the solutions proposed by legislators and SCDOT will help address the issues highlighted in this new report.