
Dr. Matthew Ladner
Hurricane Gray: Age Demographic Change And The Near Future Of South Carolina Education
Dr. Matthew Ladner
America is witnessing profound changes in the age makeup of its population. Put simply there are more grandparents and grandchildren, with fewer people in-between. What does that mean for South Carolina? It means that there will be increased demands on the state to cover expenses such as Medicaid, government pensions, senior services and education. And there will be a disproportionately smaller number of working taxpayers to cover the costs.
Read this groundbreaking report, presented in partnership with the Foundation for Excellence in Education and Palmetto Promise Institute, to find out what South Carolina can do today to prepare for Hurricane Gray.
Hurricane Gray Swirls Toward South Carolina
The baby boom generation, a huge cohort of 76 million Americans born between 1945 and 1964, has long set cultural and political trends. Their retirement may make the biggest splash of all. The first baby boomers became eligible for federal early retirement (Social Security and Medicare) benefits in 2008.
Until the year 2030, an average of American 10,000 baby boomers per day will reach the age of 65. By 2030, all surviving baby boomers will have reached 65 years or older.
Known as “The Grey Tsunami” or “Hurricane Gray” the retirement of the baby boom generation will represent an unprecedented challenge to the American social welfare state. Age demographic change will have a large impact on public life and will require an update of the American social welfare state.
Over the next decade and a half, South Carolina’s baby boomers will retire and send their grandchildren off to school. The United States Census Bureau projects South Carolina’s percentage of elderly residents to greatly exceed that of contemporary Florida by 2030 on a percentage basis. Simultaneously, the Census Bureau projects South Carolina to add thousands of school-aged children.
Broadly speaking, the elderly utilize public health spending at disproportionate rates while the young utilize K-12 education spending. The South Carolina budget spends the single highest percentage on Medicaid and the next largest on K-12 education. The simultaneous increasing numbers of both elderly and young people seems certain to require the reimagining of both health care and education delivery—both must become more cost effective and efficient. Moreover, this reimagining needs to happen sooner rather than later.
Others are noticing these trends and the important implications for state policies. For example, Ronald Brownstein has written a series of provocative National Journal articles about American demographic change and inter-generational conflict under the theme of the “Brown and the Gray.” He describes the two massive generations—the old and predominantly white baby boomers and older vs. the young and much more ethnically diverse— as two tectonic plates. The plates collide, building seismic, or in this case, political pressure. South Carolina will see increasing intergenerational seismic pressure. The beige and gray generations see the world differently, and will have different funding priorities for state government.
So why does this relate to education? First, much of the 2030 working-age population sits in South Carolina classrooms right now. Today’s students will find themselves as the working-age taxpayers responsible for paying for the public services that benefit the elderly and young residents. It would be profoundly wise to get as many of these students as possible numerate, literate and otherwise prepared for the jobs they will face not only so that they can earn a good living, but to make sure all of South Carolina can maintain its prosperity.
Second, this generation of students who will become the working citizens of 2030 will need to wrestle with the problem of how to afford health care assistance for the elderly and K-12 and higher education for the young. In 2030, South Carolina projects to have more elderly, more youth and fewer working-age people as a percentage of the total population paying the bills. South Carolina needs to get as many of today’s students as possible proficient in vital academic subjects and prepared for success in either college or the workplace. Growth and innovation in education represent by far the most amenable strategy for thriving and surviving in a state that will simultaneously grow younger and more elderly.
South Carolina has a track record of improving educational results over the last 20 years. Students, educators and policymakers should accelerate the pace of this improvement to ensure that South Carolina survives and thrives in the arduous years ahead.
Projections of South Carolina’s Changing Age Demography
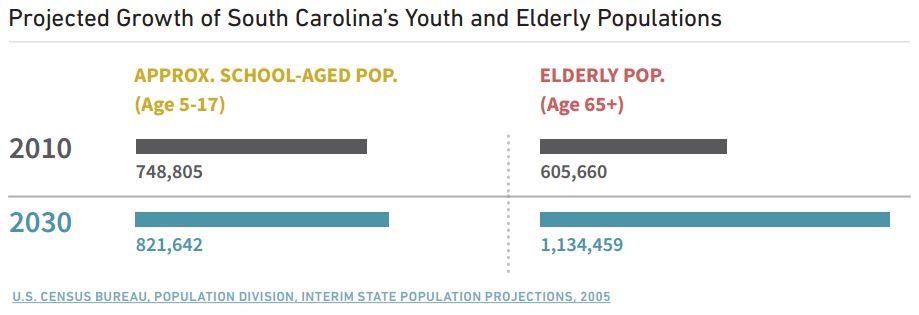
South Carolina faces a tough transition over the next 15 years. Between people moving into the state and South Carolina’s resident baby boom population aging, the Census Bureau projects the state’s elderly population will nearly double between 2010 and 2030. The growth in the elderly population has a variety of public policy implications, especially in terms of economic growth and state health care expenses.
Simultaneous to the growth in the elderly population, projections also foresee an increase in South Carolina’s youth population. The Census Bureau foresees an increase of 72,837 5-17 year olds between 2010 and 2030, approximately a 10 percent increase. The working-age population at any given point in time bears most of the tax burden for services to the young and old. South Carolina, along with the rest of the nation, faces an especially challenging future.
Demographers and economists measure societal strain caused by age demography by “total age dependency ratios.” Generally, at any given point in time, working-age people bear the primary burden of financing current education and health spending, whereas the young and the elderly consume such services disproportionately. Broadly speaking, one can think of a total age dependency ratio as the number of people riding in society’s cart based upon age compared to every 100 people pushing the cart. This is not to say that every person over the age of 65 is “dependent” or anything of the sort. We all know people over 65 that you would not trade for a platoon of 18 year olds. Demographers look at these figures broadly rather than deterministically.
A low age dependency ratio entails many workingage people and relatively few young/elderly people. Not surprisingly, this translates to faster rates of economic growth. Conversely, a high total age dependency ratio translates to fewer working-age people supporting services for a larger number of young and elderly people.
In the 1980s and the 1990s, the baby boom generation were in their prime earning years, making lots of money and paying lots of taxes. Because the baby boom had turned to baby bust in the 1960s, there were more adults paying taxes per children attending school in the past. The size of the elderly population had been much smaller in the past than what looms in the future. South Carolina had one of the lower state total age dependency ratios in 2010, but it will increase year by year.
Total age dependency ratios sound complicated but actually represent a fairly simple calculation. To calculate a state or nation’s total age dependency ratio, you add the number of people aged 65 and older to those below the age of 18, and divide by the number of 18-64 year old residents. The basic concept is that elderly and the young consume state services at a higher rate, while working-aged people generate the tax revenue to provide vital state services like health care and education.
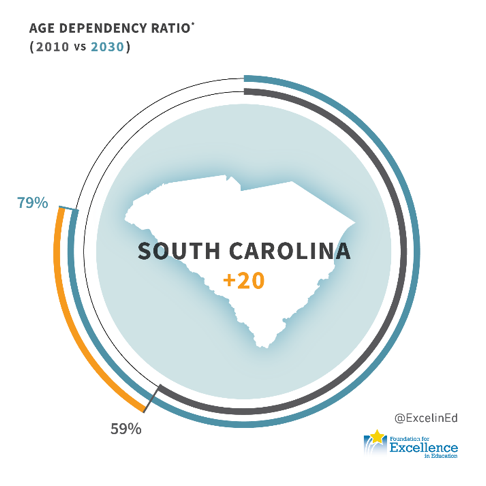
The United States Census Bureau projects South Carolina’s total age dependency ratio to increase from 59% in 2010 to 79% in 2030.
In 2010, for every 100 working age people, South Carolina had 59 people under 18 and over 65. In 2030, the Census Bureau projects that it will be 79 young/old for every 100 working age people. In the worst case scenario, a profoundly unpleasant intergenerational struggle between the young and the old for limited public dollars for health care and education could ensue. This is precisely the scenario that South Carolina policymakers should endeavor to avoid.
The South Carolina Budget and Uncle Sam’s Balance Sheet
The federal government provides over 30 percent of the total funding by state governments nationwide in the form of formula funding or matching and categorical grants. In Fiscal Year 2014, 34 percent of the funds spent by the South Carolina budget came from federal funds. Needless to say, South Carolinians pay federal taxes and thus participate in joint federal/ state spending initiatives like all other states (South Carolina’s percentage of spending coming from federal sources was only slightly above that of the average state in Fiscal Year 2014). However, the ability of the state to maintain current levels of spending would be impacted by a tightening of federal spending absent a substantial increase in state taxes. The looming retirement of the baby boom generations raises large questions regarding the ability of the federal government to maintain state spending programs at current levels.
The federal government currently carries $16 trillion in debt and has unfunded entitlement liabilities of $55 trillion, according to estimates from the Office of Management and Budget and United States Department of Treasury, respectively. Ten thousand baby boomers a day reaching retirement age raises substantial uncertainty regarding the stability of federal funding in the provision of vital state services such as education and health care.
How the federal government will manage an evergrowing cohort of individuals eligible to draw upon Medicare and Social Security looms large over most discussions of American age demography. It remains an open question of how long the federal government will maintain financial assistance for major state spending initiatives. Lawmakers would be prudent to expect a diminished ability for Uncle Sam to maintain the current level of state spending.
Exactly how the federal budget drama plays out is both uncertain, and beyond the scope of the present paper.
The looming need for the federal government to balance expenditures, spending, taxes and commitments alone should be enough to spur South Carolina policymakers to seek policy innovation.
The key in the provision of services lies not just in how many resources we devote to them, but also in the effectiveness of each dollar spent.
The same age demographic forces plaguing the federal government will independently impact South Carolina, perhaps indirectly through the availability of federal funds and directly in the form of increased demand for state services. Even if the federal government were able to maintain current levels of financial aid to states, South Carolina would still face increasing challenges in the form of decreased state revenue and increased demand for health care and education services.
State Health Care Spending And The Elderly
The tension between health and education spending has already been playing out in South Carolina’s annual budget battles, and health spending has been squeezing out a great deal of other spending in advance of Hurricane Gray. Medicaid became the single largest spending program in state budgets years ago, eclipsing K-12 education.
The federal government provides more of the total funding for Medicaid than K-12, but this should not comfort anyone. Of course, South Carolinians pay federal taxes in addition to state taxes, so rapidly increasing Medicaid costs hit them on both sides. Moreover, the federal government’s own looming need to cope with the retirement of the baby boom generation creates a systemic source of risk.
People often confuse the Medicaid and Medicare programs, and this is especially apt to happen when discussing the elderly. In the broadest terms, Medicare is a federal health care program for the elderly. States do not play a role in financing or administering the Medicare program. States do, however, finance Medicaid. Most understand Medicaid as a program for the poor, but a great deal of Medicaid spending goes to the elderly.
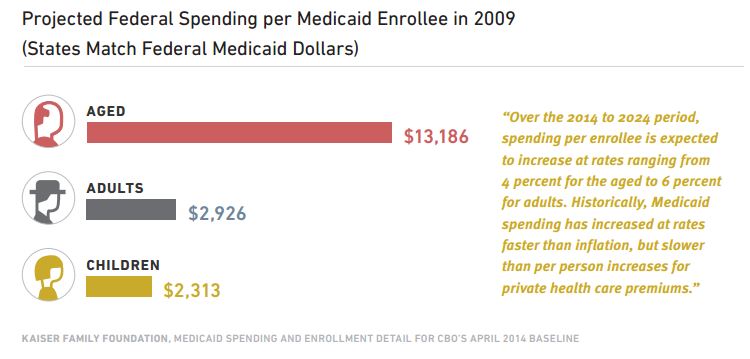
Nationwide Medicaid spending per enrollee in 2009 was $2,313 for children and $2,926 for nondisabled adults. Per enrollee, spending for the elderly ($13,186) stood at about seven times the per Medicaid enrollee spending for children and adults. The elderly and disabled have higher utilization and intensity of use for acute care services and the elderly and disabled are more likely to use long-term care services.
Congress took action in 1988 to require states participating in the Medicaid program to cover health costs not covered by Medicare for lowincome residents and those holding below a certain level of financial assets. This action links the two programs and creates a state obligation for funding.
One can only describe the interaction between Medicaid and Medicare as complex. Many elderly Americans access Medicaid in addition to Medicare. States and the federal government jointly finance Medicaid through a system of federal matching grants to the states. An aging population will impact state finances in a variety of ways, but most obviously through the demand for Medicaid spending.
A recent analysis by Moody Investor Services found that several states will face mounting demands for health care spending due to population aging.
In 2011, only 19 percent of Medicaid spending in South Carolina was consumed by the elderly, compared to the national average of 21 percent. This owes in part to South Carolina’s relatively small elderly population at the time. In 2010, the percentage of the South Carolina population aged 65 and older just above the national average, but the percent over 85 fell below the national average. As detailed above however, South Carolina’s elderly population will expand steadily in coming years.
Moody’s notes that cost control of elderly health care has proven difficult politically. Changes to Medicaid services at the state level require approval by the federal government while politics in the state can make cost containment difficult. “The electoral power of a growing elderly population and the political influence of long-term care providers are hurdles to reform,” Moody’s noted.
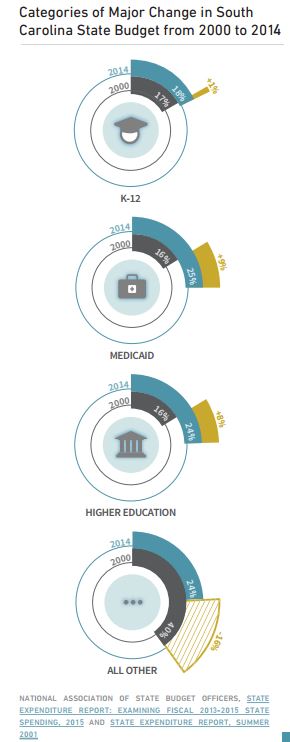
In 2000, South Carolina spent 16.9 percent of the state budget on K-12 education and 16.1 percent on Medicaid. In 2014, the state spent 24.6 percent of the budget on Medicaid and 18.4 percent on K-12 education. The figure to the right shows that Medicaid and higher education funding increases have eclipsed all other spending trends in South Carolina’s budget during this period.
The large increase in Medicaid and higher education spending has come primarily at the expense of the “All Other” category employed by the National Association of State Budget Officers (NASBO). “All Other” spending represented almost 27 percent of the budget in 2000, but only 17 percent in 2014. NASBO includes many types of spending in this category, including the Children’s Health Insurance Program (CHIP), institutional and community care for the mentally ill and developmentally disabled, public health, some employer contributions to pension and health benefits, economic development, environmental spending, state police, parks and recreation, housing assistance and aid to local government.
Many South Carolinians care very deeply about these policy areas in addition to K-12 education. More efficient delivery of such services deserves celebration, especially if taxpayers experience gains in quality to accompany efficiency gains. For instance, the aim of a K-12 system is not to spend money but rather to educate students to the highest possible levels with the resources available. The budget trends leave little room for doubt that increases in Medicaid spending has had a “crowding out” effect on other types of state spending—creating a need for efficiency gains in service delivery in order to maintain the same or better results.
As South Carolina’s population ages and the state’s school-aged population expands, additional pressure will be brought to bear on K-12 budgets. Research by Massachusetts Institute of Technology economist James M. Poterba may be of additional concern regarding district bond and override elections. In school spending data, Poterba found that an increase in the elderly population in a jurisdiction leads to a decrease in school spending per child. Many elderly people live on fixed incomes and thus may possess a preference to avoid tax increases. More ominously however, Poterba’s research found a more pronounced effect when the ethnic profile of the elderly people varied from that of the students.
Summing up, South Carolina faces foreseeable additional demand for health care spending and an uncertain mid-to-long run questions concerning the supply of federal funds.
This problem looks to grow more acute over time. Districts may also face a more skeptical public in local elections. Pressures will rise steadily for a higher return on investment on K-12 spending.
South Carolina Has Improved Academic Achievement Over Time
A review of the recent past may inform us to the possibility of improving education outcomes. There is good news for South Carolinians: this has been achieved in the past. The figure below shows proficiency rates from the National Assessment of Educational Progress (NAEP) on the mathematics exams for fourth and eighth graders. Proficiency on NAEP represents a relatively high academic bar, but one that you want as many students as possible to clear. For some perspective, Massachusetts achieved the highest state proficiency rate on any NAEP exam in 2011 and 2013 with rates of 58 percent on the NAEP fourth-grade mathematics exam. Massachusetts has the highest NAEP scores on all four tests and ranks relatively high among European and Asian countries in equating studies linking NAEP scores with international exams.
In 1992, only 13 percent of South Carolina fourth graders scored proficient on the NAEP mathematics exam, and 15 percent of eighth graders scored proficient. The performance of South Carolina students fell well below the national average on both tests in 1992. Between 1992 and 2015, South Carolina students gained 23 percentage points in fourth-grade 08ExcelinEd Hurricane Gray Swirls Toward South Carolina: Age Demographic Change and the Near Future of South Carolina Education math and 11 percentage points in eighth-grade math. A gain of 10 points approximately equals an average grade level worth of progress on the NAEP, such that if we gave a group of fifth graders the fourth-grade math exam we would expect them to do about 10 points better than a similar group of fourth graders. Thus during the 1992 to 2015 period, South Carolina students succeeded in learning a great deal more math during elementary and middle school than their predecessors, albeit still falling below the national average.
South Carolina students have also demonstrated progress on the NAEP reading exams. Between 1992 and 2015, South Carolina fourth graders gained 11 percentage points on the fourth-grade reading test. Thus the fourth graders of 2015 were reading at a level that we might have seen from the average fifth grader in 1992. South Carolina students gained six points on eighth-grade reading from 1998 to 2015. The improvements in NAEP scores mirror other improvements seen in South Carolina schools. For instance the four-year cohort graduation rate improved from 74 percent in 2011 to 78 percent in 2013.
Without these improvements, South Carolina would have far less shelter from Hurricane Gray. However, much more improvement is needed. The task ahead however remains daunting.
South Carolina needs further academic gains and needs them in a cost effective manner. This does not necessarily mean spending less money, but it does mean that the state faces a growing need to increase the return on investment for spending—the bang for the education buck must increase.
Some will question whether this is remotely possible. However, policymakers in other states have achieved it.
Digital Learning and Course Access
We are in the middle of a technological shift in education. Recent advances in technology and the emergence of new models of learning present the opportunity to reach every student with the personalization they need to succeed. Education is no longer limited by what can be offered in one building or one type of school.
Expanding digital learning is a way to improve outcomes both inside and outside the districts and meet rising demand for different types of courses. South Carolina is one of twenty-four states with a statewide virtual school. Virtual South Carolina (VirtualSC) is the fifth largest statewide virtual school provider of supplemental online courses.
In 2014-15, VirtualSC saw its largest year over year growth, expanding nearly 65 percent to 40,363 course enrollments from 24,491 course enrollments in 2013-14.
However, VirtualSC is still a relatively modestly sized state virtual school compared to North Carolina Virtual School Program (NCVSP) or Florida Virtual School (FLVS), where students enrolled in more than 110,000 and 390,000 courses in 2014-15 (approximately 5 percent of South Carolina’s student population, compared to 7 percent for North Carolina and 15 percent for Florida). South Carolina, like many other states, also allows full-time virtual charter schools to operate across the state.
While state virtual schools and virtual charter schools authorized by a charter board and the state expand some access to courses for some students, a new policy initiative is developing in states throughout the nation that could build on the efforts of VirtualSC.
Course Access is a state-level policy that provides public school students with expanded course offerings across learning environments from diverse, accountable providers.
Participating students have the right to enroll in qualifying courses and earn class credit for courses completed through the program, and classes can be offered online, in person or as a combination of the two.
Course Access programs can include local university courses, career and technical education courses leading to industry recognized certifications, or advanced course, while allowing students to stay on track for graduation. It also has the benefit of being lower cost to the state, since the state role changes from providing the courses to approving providers that offer courses. At the time of the creation of FLVS and other state virtual schools, it made sense for the state to build and provide courses because there were so few providers. Today, there are hundreds of diverse providers from the Khan Academy to higher education courses, free Massive Open Online Courses (MOOCs), school district created courses and those created by entrepreneurs in Silicon Valley.
Course Access provides small and large districts, rural and suburban, the opportunity to use cost-effective strategies to harness technology to: offer students a broad and diverse set of courses; ensure quality in content, instruction and support; and stretch limited budgets.
It also has the benefit of being lower cost to the state, since the state role changes from providing the courses to approving providers that offer courses. At the time of the creation of FLVS and other state virtual schools, it made sense for the state to build and provide courses because there were so few providers. Today, there are hundreds of diverse providers from the Khan Academy to higher education courses, free Massive Open Online Courses (MOOCs), school district created courses and those created by entrepreneurs in Silicon Valley.
While Course Access programs are still a relatively new policy with best practices still being developed, there are states taking advantage of the opportunity that the policy offers. Florida has been a national leader in supplemental online course offerings through its support for FLVS, and given the tightening of the age demographic vise, other states can look to Florida as a leader in adapting from primarily a state virtual program to a Course Access program. Florida is building upon already-existing initiatives in the state—from FLVS to districts that have partnered with an outside virtual course provider. The Florida Approved Courses and Tests (FACT) Initiative takes these options, as well as opens eligibility to other providers and courses, and allows them to be offered statewide. To ensure quality, Florida has detailed both requirements for courses and providers and an application for providers seeking to participate in its Course Access program through the Florida Department of Education. To help communicate these options, The Florida Department of Education also publishes a list of available statewide courses on its website. Without a statewide process, districts who want to offer additional courses bear the financial and operating burden of approving courses, ensuring providers are high-quality and monitoring student progress. Smaller or rural districts who would not be able to offer Pre-Calculus or Chemistry due to financial or staffing restraints, would be able to offer these courses to students through a Course Access program.
Beyond expanding course offerings for students, Course Access programs also help districts stretch already limited budgets.
Without a statewide process, districts who want to offer additional courses bear the financial and operating burden of approving courses, ensuring providers are high-quality and monitoring student progress. Smaller or rural districts who would not be able to offer Pre-Calculus or Chemistry due to financial or staffing restraints, would be able to offer these courses to students through a Course Access program.
Florida educators and policymakers, along with other states doing Course Access, are expanding course options for students from diverse, high-quality providers. The overall effect has been to complement the existing K-12 system.
The task ahead is to drive still greater learning gains and still greater options for students and districts. Saving money helps finance other public priorities, but higher passing rates help with the long-term prospects for the state. To achieve both goals simultaneously represents a treasure for both students and taxpayers.
Incentive Funding
Another example of additional spending with a potentially high return on investment from Florida involves the provision by the state of school bonuses for the earning of college credit by exam and/or high-demand professional certifications. The policy provides a significantly greater bonus for low-rated schools that help students earn college credit by exam and created a partnership with a non-profit to identify and recruit students from student groups under-represented in Florida universities to seek credit-earning opportunities.
Florida saw a substantial increase in students passing Advanced Placement exams as a result of these policies and practices. In 2014, Florida ranked third overall on the percentage of graduates passing an Advanced Placement exam. The College Board found that Florida ranked second on the overall increase in Advanced Placement passing rates between 2003 and 2013. African-American and Hispanic students not only participated in this increase, they helped to lead the charge.
Since the advent of the program, the number of African-American and Hispanic students passing Advanced Placement exams has more than quadrupled.
Students taking Advanced Placement exams have shown a greater level of persistence in college, including students who failed to pass the exams. In 2013, South Carolina ranked 25th among states for Advanced Placement exams taken per 1,000 junior and senior students, while Florida ranked 3rd.
Florida lawmakers also wanted to support the longterm success of students by providing them with real world skills that employers value. Accordingly they created a similar bonus program to reward students for earning professional certifications in highdemand fields. In this way, Florida lawmakers have invested in the career success of students whether they choose to go to college or not.
In facing a future with more elderly and young residents, South Carolina lawmakers need to take strong action to equip every student with the opportunity to enjoy success in college or a career, or in both.
We should regard each and every student that fails to graduate or graduates without the skills to succeed in either college or the workplace as a tragic waste of human potential. The state cannot afford to make this mistake now, and the cost will rise dramatically in the future.
Expanded Parental Options – Charter Schools and ESAs
Choice programs have the ability to cater to the needs of the individual student, deliver higher rates of parental satisfaction and free up resources for other critical state activities.
Parental choice should be viewed as a fundamental parental right regardless of a state’s circumstances.
Given South Carolina’s circumstances, it should be understood to have large practical benefits in addition. Lawmakers can and should do more to benefit students and taxpayers on the parental choice front.
For now, South Carolina has too few charter school students to reliably sample in NAEP. Other states with more mature and larger charter sectors have seen impressive scores on NAEP at a lower overall cost. For instance, Arizona displayed NAEP scores for charter school students that ranked them among the highest performing states in 2015 across a variety of subgroups—including states with substantial student demographic advantages vis a vis the charter school students.
Academic comparisons between charter and district schools can be fraught with peril. Apparent differences in scores can be the result of differences in student demographics, which cannot be perfectly controlled for in the absence of a well-designed and executed random assignment study. Outside of such possible differences, students tend to take a temporary academic hit when they transfer between schools, and schools like most organizations have a “shakedown cruise” period in the early years as they find their “sea legs.” In other words, you don’t tend to find your best results from a new school in year one as routines are established. When you have an entire sector with many brand new schools full of students who just transferred in, a snapshot look at test scores can contain what may ultimately prove to be an optical illusion of lower scores. As a charter sector matures and new schools come to constitute a smaller percentage of the total sector, they will make a more accurate reading of aggregate performance.
Similar to Arizona, Florida’s charter school students’ 2015 NAEP scores place them amongst the highest performing states across a variety of subgroups.32 Arizona charter schools meanwhile educate a majority minority student population and receive more than a thousand dollars less in public funds per pupil than Arizona district schools. This is a combination that has proven good for Arizona students and Arizona taxpayers. The Center for Education Reform gives South Carolina’s charter school law a “B” and the Arizona law an “A” on a multi-faceted evaluation. South Carolina children likely have more to gain from charter schools.
Education Savings Accounts (ESAs) represent a next generation choice model. Five states—Arizona, Florida, Mississippi, Nevada and Tennessee—have adopted ESA programs since 2011. An ESA program adopts an account-based approach, managed by parents and overseen by state authorities. Accounts have limited but multiple uses: private school tuition, individual public school courses, community college and university tuition and fees, services from licensed therapists, online education programs, transportation, books and curriculum and savings for future higher education use. The last use creates an incentive for parents to carefully manage funds and seek the biggest bang for the education buck.
A voucher or scholarship approach resembles a landline phone. A landline phone is an amazing piece of technology that does one function reliably and well. Someone from the past would be astounded by a landline phone and what it can do. An ESA however more closely resembles a smart phone. It can do multiple things.
In fact, lawmakers have already devised new uses for programs for inclusion in the accounts. Nevada lawmakers first introduced transportation with a dollar limit into the accounts in 2015, addressing a major concern of school choice equity in the process. ESAs move closer to a system of full parental control over education and create proper incentives for service providers to deliver the best possible products at the lowest possible price.
Facing a huge overcrowding problem, with district school unable to either build enough space or hire enough public school teachers, Nevada lawmakers created the nation’s most robust choice program in 2015. Nevada’s ESA program passed as part of a comprehensive set of policies aimed at improving education outcomes. The law makes all public school students eligible to transfer into the ESA program, and addresses equity concerns by providing higher levels of subsidy for low-income and children with disabilities. Striking an appealing balance between the need for academic transparency to the public and the independence and diversity of private education providers, the bill requires ESA students to take a nationally normed reference test (e.g. the Stanford 10 or Iowa Test of Basic Skills).
As has been the case for every private choice program, no mad exit from the public school system has ensued. Private choice programs have always started small and grown incrementally over time with increasing public awareness and incremental increases in private school supply. Nevada is on the same track with around 4,100 families applying during the initial “early open enrollment” period in 2015. Nevada expects the program to have rolling funding and regular open enrollment periods.
South Carolina policymakers should carefully study Nevada’s law and the implementation process carried out by Nevada State Treasurer Dan Swartz that included the state contracting with a private firm experienced in the management of health savings accounts.
A broadly available ESA program could slow the rate of district enrollment growth, and increasing and saving the state money could benefit South Carolina students and taxpayers. Nevada has set a high bar, but South Carolina could create an even more powerful mechanism for parental control of education.
Conclusion
Past success in policy innovation should inform future action because the path will become increasingly rocky. In the worst case scenario, South Carolina would experience slowing economic growth and young and old people would set about fiercely battling over limited resources for health care and education funding. This scenario can be avoided, but improved K-12 outcomes must play a role in securing the prosperity needed to successfully navigate the future.
Specifically, South Carolina needs both improved outcomes and cost efficiencies in K-12 education to cope with K-12 enrollment growth and the pressure for increased health care spending. K-12 reform alone cannot hope to address this crisis, but it is also the case that we cannot hope to address the challenge without substantial K-12 improvement.
In South Carolina, the urgency to implement innovative and cost-effective educational solutions is particularly acute because of the Abbeville v. State lawsuit. The state legislature is under court order to better address the needs of the highest poverty school districts in the state, despite fiscal constraints.
South Carolina students should not be graduating from high-school without being prepared for success in college or else equipped with marketable job skills. Policymakers should therefore craft high-impact policies to create financial incentives for students to earn one or both of these things.
Policymakers should pursue policies to help high-quality charter school operators expand the number of seats they can offer to parents. In addition, we should put private education within the reach of a larger number of South Carolina parents through Education Savings Accounts. The vast majority of South Carolina students will continue to attend district schools regardless of what options policymakers create.
Challenges loom large, but our opportunities larger still. South Carolina’s only palatable path out of the challenge of age demographic change involves innovation. The state has a successful track record to build on. It’s time to get South Carolina scores moving again. Some will emotionally cling to an unsustainable status quo, but the need for improved outcomes in education and health care spending will become increasingly impossible to ignore or deny.
It’s time to go all in to secure a better state than the one South Carolinians inherited. Those who went before did this for you. South Carolinians today can and should do the same for the next generation.