

Editor
Performance vs. Spending: Florida & South Carolina 1999-2013
Editor
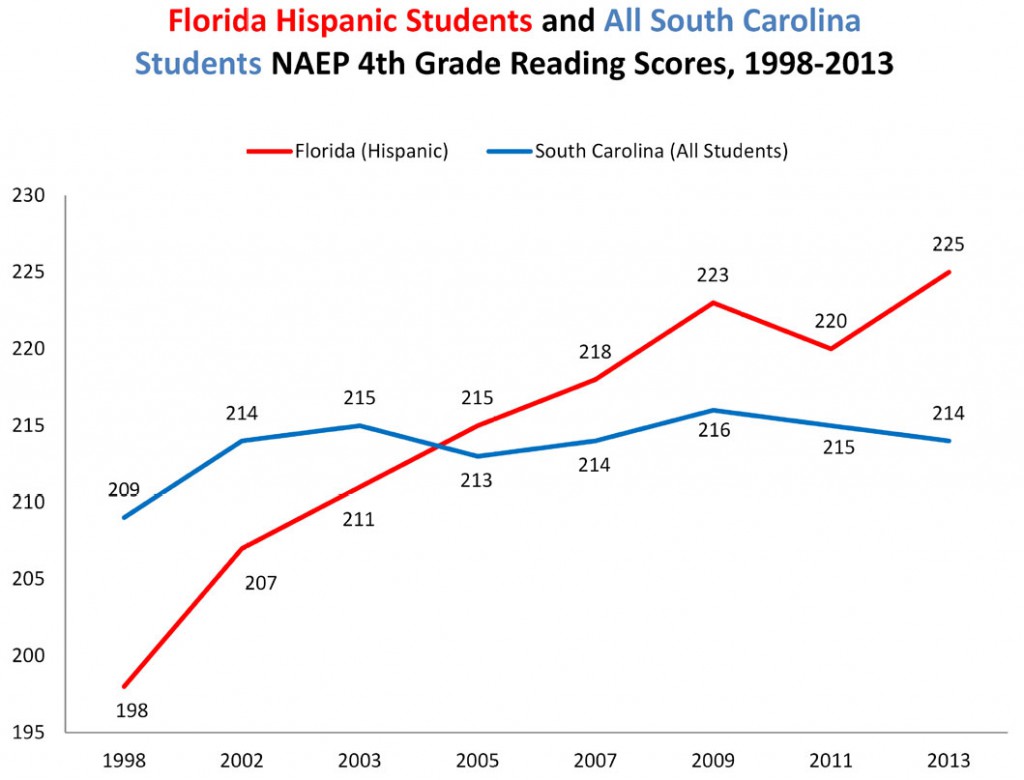
Our March, 2013 paper, Transformation: What South Carolina Can Learn from Florida’s Education Reforms, showed how South Carolina Fourth Graders actually led Florida Fourth Graders in 1998 but by 2013 fell significantly behind on key National Assessment of Educational Progress (NAEP) metrics. Before reforms enacted in Florida under Governor Bush, all South Carolina students enjoyed a 3-point lead on all Florida students. But by 2002, Florida had already closed the gap, and since that critical year, the Sunshine State has led the Palmetto State consistently.
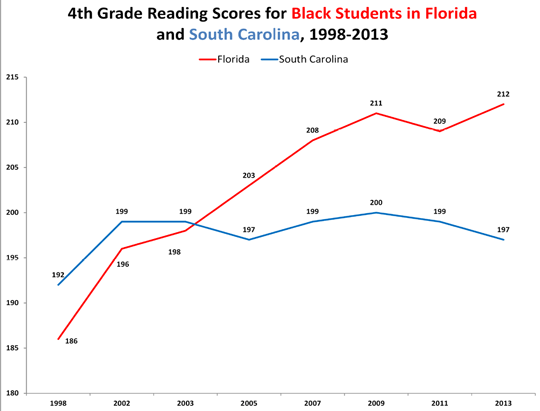
For African-American students, the Florida leap frogging exercise is similar. But the most significant comparison in the report is the performance of Florida Hispanic students versus all South Carolina students.This shows that not only was the average Florida Hispanic fourth grader a better reader than the average South Carolina fourth grader, but those who were most challenged benefitted most by reform.

Did Florida Spend Its Way to Success?
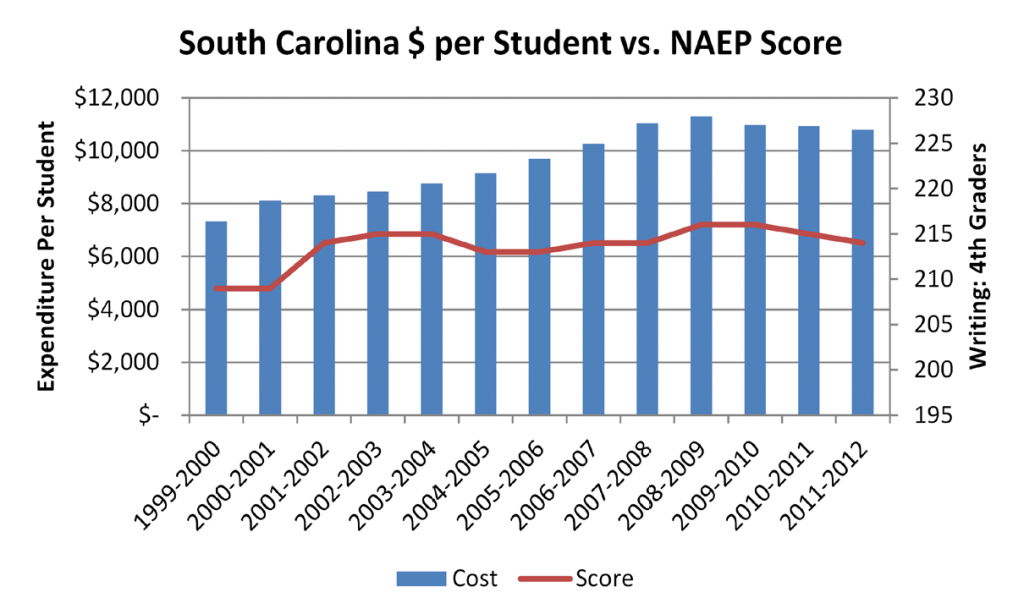
A question looming over the quantum leap of Florida fourth graders is the question of funding.Did Florida win the reading war by simply making a greater fiscal commitment to K-12 education during the key decade of 1999-2011? Did Florida buy performance? Simple funding comparisons indicate quite the opposite. Over the ten year period we are examining, South Carolina spent a total of $6,920 more per student, or an average of $692 per year. In actually expending the funds, the state of South Carolina spent an average of $438 more per student per year (or $3,506 total) than Florida during the eight year period.
Spending Does Not Equal Performance
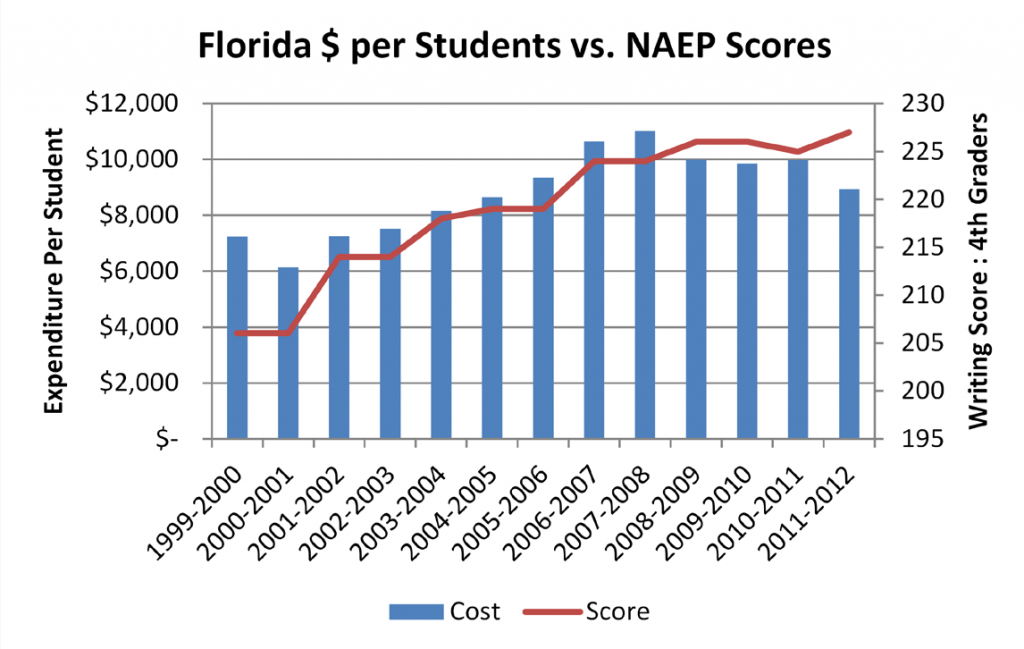
When South Carolina and Florida’s expenditures are charted with its performance, an even clearer picture emerges. Since 1999, South Carolina’s spending has been on a slight incline while its performance has been flat. During the same period, Florida has seen an increase in spending at a lower level, but its performance has increased steadily. The lesson of these simple charts and graphs for South Carolina: bold commitment to reform is the reason for Florida’s success, not simply more spending.
The Efficiency of Florida’s Success
{From “Is the U.S. Catching Up? International and State Trends in Student Achievement by Eric A. Hanushek, Ludger Woessmann and Paul E. Peterson, Education Next, Fall 2012.}
According to another popular theory, additional spending on education will yield gains in test scores.

To see whether expenditure theory can account for the interstate variation, we plotted test score gains against increments in spending between 1990 and 2009. As can be seen from the scattering of states into all parts of Figure 4, the data offer precious little support for the theory. Just about as many high-spending states showed relatively small gains as showed large ones. Some states received more educational bang for their additional expenditure buck than others.To ascertain which states were receiving the most from their incremental dollars, we ranked states on a “points per added dollar” basis. Michigan, Indiana, Idaho, North Carolina, Colorado, and Florida made the most achievement gains for every incremental dollar spent over the past two decades.