Education by the numbers in Columbia, South Carolina
PPI’s new School District Finance and Performance Dashboard is cited in COLAToday‘s deep dive into Columbia’s local school districts.
One thing doesn’t change – education is always a hot topic in South Carolina. The sentiment shared amongst most is that teachers don’t get paid enough for all that they do. We count on educators to mold the future generation with the skills they need for tomorrow.
Have you ever wondered how much it costs to teach South Carolina students these important tools? There is a helpful dashboard for that, thanks to Palmetto Promise. Today, we are breaking down the numbers of what a public education (K-12) costs in South Carolina.
💰How much do we spend?
Education spending represents approx. 40% of South Carolina’s general fund. State K-12 education spending, which comes from the Department of Education, totaled $4.8 billion in 2019-2020. This is the first time the budget reached this amount in state history. Add in local + federal spending to this sum and the annual education budget climbs to $10.4 billion (not including coronavirus federal emergency funds).
💰Where does the money go?
This one-of-a-kind dashboard compares data for each district, including per student revenue, percent spent on instruction, graduation rate, college readiness, and average teacher salary.
Let’s take a closer look and make cents of these numbers.
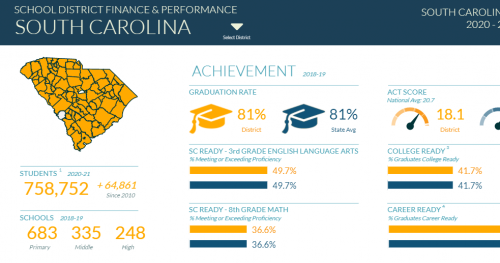
 Education stats for South Carolina | Image via Palmetto Promise Dashboard
South Carolina public education by the numbers for 2020-2021:
758,752 – Number of students in South Carolina
52,733 – Number of teachers in South Carolina
81 – Number of public school districts
683 – Number of primary schools
335 – Number of middle schools
248 – Number of high schools
81% – State graduation rate
49.7% – State average for SC Ready 3rd grade English Language Arts
36.6% – State average for SC Ready 8th grade Math
41.7% – State average for college readiness
72.5% – State average for career readiness
$14,801 – State average revenue per student
$9,497 – State average public school spending per student
$49,737 – State average teacher salary
Wondering what these numbers look like in your district? Let’s dig into the local data.

Richland School District One by the numbers | Image via Palmetto Promise Dashboard
21,660 – Total number of students in Richland One
1,949 – Total number of teachers in Richland One
30 – Total number of primary schools
10 – Total number of middle schools
9 – Total number of high schools
82% – Average for graduation rate
41.5% – Average for SC Ready 3rd grade English Language Arts
25% – Average for SC Ready 8th grade Math
30% – Average for college readiness
66.3% – Average for career readiness
$21,160 – Average revenue per student
$15,009 – Average public school spending per student
$52,537 – Average teacher salary
51.7% – Average spent on instruction

Richland School District Two by the numbers | Image via Palmetto Promise Dashboard
27,540 – Total number of students in Richland Two
1,949 – Total number of teachers in Richland Two
23 – Total number of primary schools
7 – Total number of middle schools
6 – Total number of high schools
87% – Average for graduation rate
51.1% – Average for SC Ready 3rd grade English Language Arts
39.9% – Average for SC Ready 8th grade Math
42.4% – Average for college readiness
80.8% – Average for career readiness
$16,098 – Average revenue per student
$11,045 – Average public school spending per student
$52,149 – Average teacher salary
54.4% – Average spent on instruction

Lexington School District One by the numbers | Image via Palmetto Promise Dashboard
26,947 – Total number of students in Lexington One
1,923 – Total number of teachers in Lexington One
16 – Total number of primary schools
7 – Total number of middle schools
5 – Total number of high schools
90% – Average for graduation rate
60.1% – Average for SC Ready 3rd grade English Language Arts
40.2% – Average for SC Ready 8th grade Math
53.4% – Average for college readiness
84.1% – Average for career readiness
$15,136 – Average revenue per student
$11,040 – Average public school spending per student
$52,689 – Average teacher salary
56.9% – Average spent on instruction

Lexington School District Two by the numbers | Image via Palmetto Promise Dashboard
8,650 – Total number of students in Lexington Two
629 – Total number of teachers in Lexington Two
6 – Total number of primary schools
4 – Total number of middle schools
2 – Total number of high schools
76% – Average for graduation rate
37.3% – Average for SC Ready 3rd grade English Language Arts
29.7% -– Average for SC Ready 8th grade Math
33.7% – Average for college readiness
63% – Average for career readiness
$16,061 – Average revenue per student
$10,626 – Average public school spending per student
$49,037 – Average teacher salary
53.8% – Average spent on instruction

Lexington School District Three by the numbers | Image via Palmetto Promise Dashboard
1,988 – Total number of students in Lexington Three
147 – Total number of teachers in Lexington Three
1 – Total number of primary schools
1 – Total number of middle schools
1 – Total number of high schools
84% – Average for graduation rate
37.7% – Average for SC Ready 3rd grade English Language Arts
22.8% – Average for SC Ready 8th grade Math
31.3% – Average for college readiness
74.2% – Average for career readiness
$17,677 – Average revenue per student
$12,798 – Average public school spending per student
$48,839 – Average teacher salary
49.6% – Average spent on instruction

Lexington School District Four by the numbers | Image via Palmetto Promise Dashboard
3,103 – Total number of students in Lexington Four
222 – Total number of teachers in Lexington Four
2 – Total number of primary schools
1 – Total number of middle schools
1 – Total number of high schools
80% – Average for graduation rate
27.4% – Average for SC Ready 3rd grade English Language Arts
9.3% – Average for SC Ready 8th grade Math
16.1% – Average for college readiness
50.5% – Average for career readiness
$15,168 – Average revenue per student
$10,160 – Average public school spending per student
$46,340 – Average teacher salary
51.7% – Average spent on instruction

Lexington-Richland School District Five by the numbers | Image via Palmetto Promise Dashboard
17,009 – Total number of students in Lexington-Richland Five
1,306 – Total number of teachers in Lexington-Richland Five
13 – Total number of primary schools
4 – Total number of middle schools
4 – Total number of high schools
88% – Average for graduation rate
60.2% – Average for SC Ready 3rd grade English Language Arts
50.4% – Average for SC Ready 8th grade Math
60.4% – Average for college readiness
81.8% – Average for career readiness
$15,737 – Average revenue per student
$12,177 – Average public school spending per student
$54,160 – Average teacher salary
55.1% – Average spent on instruction