
Fiscal Health Rankings: SC is 18th
South Carolina might have a rocky fiscal road ahead according to a study recently released by the Mercatus Center at George Mason University.[i] The research measured five categories of fiscal health in each U.S. state and Puerto Rico—cash solvency, budget solvency, long-run solvency, service-level solvency, and trust fund solvency.[ii]
According to the data, South Carolina clocks in at 18th overall for fiscal condition compared to the other fifty states—that’s a step backward from our ranking of 17th for 2015.[iii]
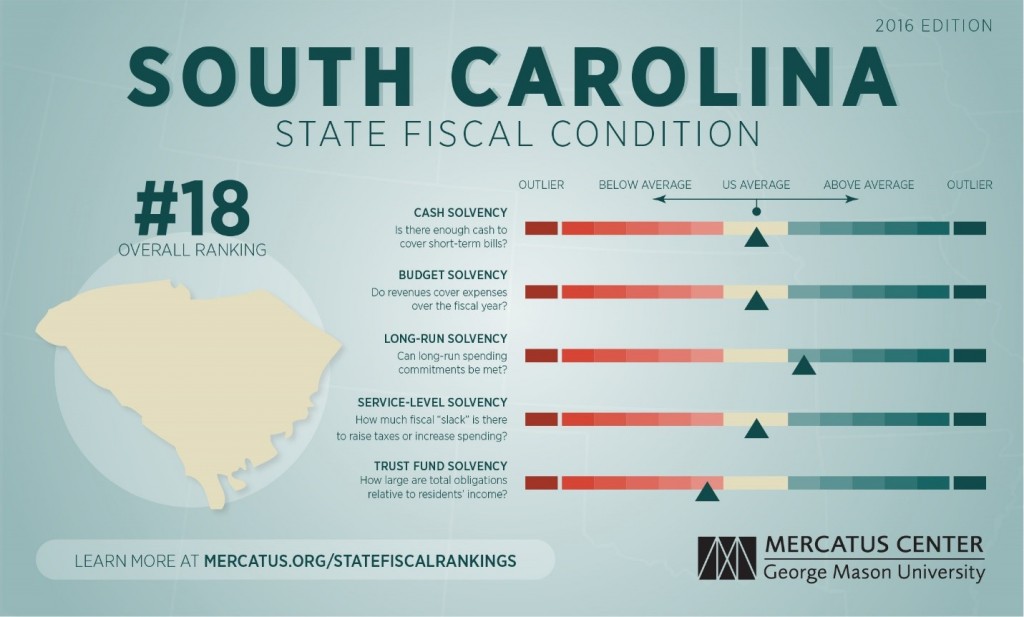
As the chart illustrates, South Carolina consistently hits the below-average or average mark for each of these categories. However, it’s important to note these rankings don’t tell the whole story. The rankings simply reflect a score relative to the performance of the other states; the core fiscal metrics (all those solvency categories) are the true barometer of the Palmetto State’s fiscal health. Here how the metrics break down:
- Cash Solvency: This metric measures the ability to pay short-term expenses. South Carolina has between 2 – 3.5 times the cash needed to cover its short-term bills.
- Budget Solvency: This metric measures revenue relative to expenses. South Carolina’s revenue exceeded expenses by 7%.
- Long-Run Solvency: This metric determines if long-run spending commitments can be met. According to this data, South Carolina’s long-term liabilities tie up only 20% of total assets—far lower than the national average of 47%. However, other data from Truth in Accounting (a non-profit CPA group) suggests South Carolina has a dirty-little debt secret that makes the situation more urgent than first thought.
- Service-Level Solvency: This metric measures how much “fiscal slack” is available to raise taxes to counteract increases in spending. South Carolina’s revenues are 13% of total state personal income, and spending is 12% of state personal income leaving slight fiscal slack.
- Trust-Fund Solvency: This metric measures how large total obligations are relative to resident’s income. Total unfunded liabilities are low at $3.3 Billion or 2% of state personal income. This factor places South Carolina well below the average debt of the other states.
At first glance, one might be tempted to find this performance acceptable. But why should we settle for below-average or average when we could be doing so much better?
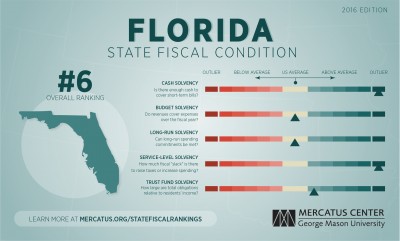
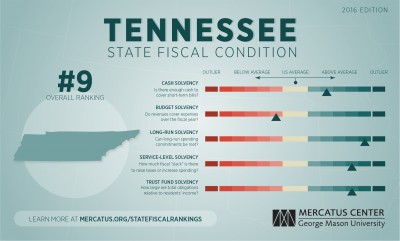
South Carolina ought to be blazing the common-sense, future-focused, people-centered fiscal policy path forward, but instead we continue to stumble behind our southern counterparts. Consider Florida and Tennessee, for example.
In reality, South Carolina still has a lot of work to do when it comes to budget stability, fiscal health, and overall competitiveness. This becomes especially obvious when we combine the data from the Mercatus study and the data from ALEC’s Rich States, Poor States index. In order to improve these scores, several steps must be avoided and other steps must be taken. Here are a few simple suggestions:
- DO NOT expand Medicaid in South Carolina.
- DO increase competitiveness by reforming South Carolina’s tax structure.
- DO reveal South Carolina’s dirty-little debt secret.
- DO sustain the momentum of our manufacturing revolution.
[i] Ranking the States by Fiscal Condition, 2016 Edition. A study of U.S. states and Puerto Rico’s fiscal health by the Mercatus Center at George Mason University.
[ii] Added together, these factors help determine the overall fiscal solvency of a state. Fiscal solvency captures whether a state is able to meet its short-term and long-term obligations without incurring excessive debt, engaging in budget gimmicks, or using other evasive tactics.